The Hartford 2013 Annual Report Download - page 81
Download and view the complete annual report
Please find page 81 of the 2013 The Hartford annual report below. You can navigate through the pages in the report by either clicking on the pages listed below, or by using the keyword search tool below to find specific information within the annual report.-
 1
1 -
2
-
3
-
4
-
5
-
6
-
7
-
8
-
9
-
10
-
11
-
12
-
13
-
14
-
15
-
16
-
17
-
18
-
19
-
20
-
21
-
22
-
23
-
24
-
25
-
26
-
27
-
28
-
29
-
30
-
31
-
32
-
33
-
34
-
35
-
36
-
37
-
38
-
39
-
40
-
41
-
42
-
43
-
44
-
45
-
46
-
47
-
48
-
49
-
50
-
51
-
52
-
53
-
54
-
55
-
56
-
57
-
58
-
59
-
60
-
61
-
62
-
63
-
64
-
65
-
66
-
67
-
68
-
69
-
70
-
 71
71 -
 72
72 -
 73
73 -
 74
74 -
 75
75 -
 76
76 -
 77
77 -
 78
78 -
 79
79 -
 80
80 -
 81
81 -
 82
82 -
 83
83 -
 84
84 -
 85
85 -
 86
86 -
 87
87 -
 88
88 -
 89
89 -
 90
90 -
 91
91 -
92
-
93
-
94
-
95
-
96
-
97
-
98
-
99
-
100
-
101
-
102
-
103
-
104
-
105
-
106
-
107
-
108
-
109
-
110
-
111
-
112
-
113
-
114
-
115
-
116
-
117
-
118
-
119
-
120
-
121
-
122
-
123
-
124
-
125
-
126
-
127
-
128
-
129
-
130
-
131
-
132
-
133
-
134
-
135
-
136
-
137
-
138
-
139
-
140
-
141
-
142
-
143
-
144
-
145
-
146
-
147
-
148
-
149
-
150
-
151
-
152
-
153
-
154
-
155
-
156
-
157
-
158
-
159
-
160
-
161
-
162
-
163
-
164
-
165
-
166
-
167
-
168
-
169
-
170
-
171
-
172
-
173
-
174
-
175
-
176
-
177
-
178
-
179
-
180
-
181
-
182
-
183
-
184
-
185
-
186
-
187
-
188
-
189
-
190
-
191
-
192
-
193
-
194
-
195
-
196
-
197
-
198
-
199
-
200
-
201
-
202
-
203
-
204
-
205
-
206
-
207
-
208
-
209
-
210
-
211
-
212
-
213
-
214
-
215
-
216
-
217
-
218
-
219
-
220
-
221
-
222
-
223
-
224
-
225
-
226
-
227
-
228
-
229
-
230
-
231
-
232
-
233
-
234
-
235
-
236
-
237
-
238
-
239
-
240
-
241
-
242
-
243
-
244
-
245
-
246
-
247
-
248
-
249
-
250
 |
 |
81
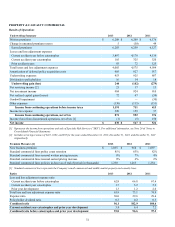
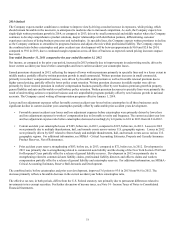
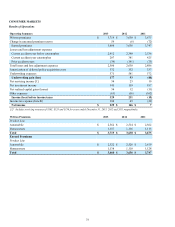
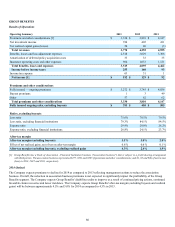
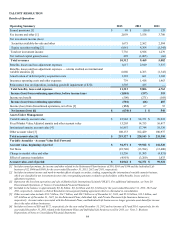
Year ended December 31, 2013 compared to the year ended December 31, 2012
Net income, as compared to the prior year period, increased in 2013 driven primarily by an improvement in the loss ratio and lower
insurance operating costs and other expenses, partially offset by a decrease in premiums and other considerations.
The decrease in premiums was driven by continued pricing discipline, our decision not to renew our largest account effective January 1,
2013 due to pricing and other considerations and management actions to reduce the association business. Insurance operating costs and
other expenses decreased in 2013 as compared to the prior year due to lower commission payments as a result of overall lower
premiums.
The improvement in the loss ratio in 2013 was primarily attributable to the long-term disability product driven by favorable claim
recoveries from claims incurred in 2013 and prior years, lower incidence trends and improved renewal pricing. Additionally, the 2012
loss ratio reflected unfavorable long-term disability severity. The increase in after-tax margin, excluding buyouts and net realized capital
gains (losses), was primarily due to an improved loss ratio.
The effective tax rate, in both periods, differs from the U.S. Federal statutory rate primarily due to permanent differences related to
investments in tax exempt securities. For further discussion of income taxes, see Note 14 - Income Taxes of Notes to Consolidated
Financial Statements.
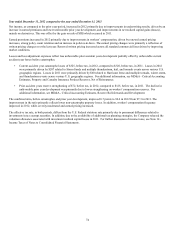
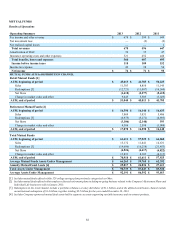
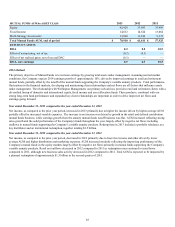
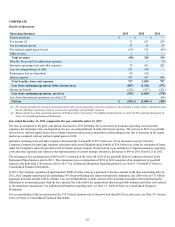
Year ended December 31, 2012 compared to the year ended December 31, 2011
Net income, as compared to the prior year period, increased in 2012. While realized capital gains improved in current year, this was
partially offset by a decrease in fully insured ongoing premiums, due to the lower sales and persistency resulting from the Company's
pricing initiatives as well as the competitive market environment.
The change in insurance operating costs and other expenses is due to lower commission payments as a result of lower sales and a
onetime payment to a third party administrator in the first quarter of 2011.
The loss ratio remained flat for both years 2012 and 2011. Loss experience in 2012 reflects stable incidence trends during the year,
although elevated when compared to historical levels, and a continuation of the slightly improving claim recoveries in group long-term
disability that emerged in mid-2012. Group life claims experience deteriorated modestly compared with 2011 but remained more
favorable than group long-term disability.
The increase in after-tax margin (excluding buyouts), excluding realized gains (losses), was primarily due to lower insurance operating
costs and other expenses, partially offset by the impact of lower premiums and other considerations due to lower sales and persistency.
The effective tax rate, in both periods, differs from the U.S. Federal statutory rate primarily due to permanent differences related to investments
in tax exempt securities. For further discussion of income taxes, see Note 14 - Income Taxes of Notes to Consolidated Financial Statements.