The Hartford 2013 Annual Report Download - page 124
Download and view the complete annual report
Please find page 124 of the 2013 The Hartford annual report below. You can navigate through the pages in the report by either clicking on the pages listed below, or by using the keyword search tool below to find specific information within the annual report.-
 1
1 -
2
-
3
-
4
-
5
-
6
-
7
-
8
-
9
-
10
-
11
-
12
-
13
-
14
-
15
-
16
-
17
-
18
-
19
-
20
-
21
-
22
-
23
-
24
-
25
-
26
-
27
-
28
-
29
-
30
-
31
-
32
-
33
-
34
-
35
-
36
-
37
-
38
-
39
-
40
-
41
-
42
-
43
-
44
-
45
-
46
-
47
-
48
-
49
-
50
-
51
-
52
-
53
-
54
-
55
-
56
-
57
-
58
-
59
-
60
-
61
-
62
-
63
-
64
-
65
-
66
-
67
-
68
-
69
-
70
-
71
-
72
-
73
-
74
-
75
-
76
-
77
-
78
-
79
-
80
-
81
-
82
-
83
-
84
-
85
-
86
-
87
-
88
-
89
-
90
-
91
-
92
-
93
-
94
-
95
-
96
-
97
-
98
-
99
-
100
-
101
-
102
-
103
-
104
-
105
-
106
-
107
-
108
-
109
-
110
-
111
-
112
-
113
-
 114
114 -
 115
115 -
 116
116 -
 117
117 -
 118
118 -
 119
119 -
 120
120 -
 121
121 -
 122
122 -
 123
123 -
 124
124 -
 125
125 -
 126
126 -
 127
127 -
 128
128 -
 129
129 -
 130
130 -
 131
131 -
 132
132 -
 133
133 -
 134
134 -
135
-
136
-
137
-
138
-
139
-
140
-
141
-
142
-
143
-
144
-
145
-
146
-
147
-
148
-
149
-
150
-
151
-
152
-
153
-
154
-
155
-
156
-
157
-
158
-
159
-
160
-
161
-
162
-
163
-
164
-
165
-
166
-
167
-
168
-
169
-
170
-
171
-
172
-
173
-
174
-
175
-
176
-
177
-
178
-
179
-
180
-
181
-
182
-
183
-
184
-
185
-
186
-
187
-
188
-
189
-
190
-
191
-
192
-
193
-
194
-
195
-
196
-
197
-
198
-
199
-
200
-
201
-
202
-
203
-
204
-
205
-
206
-
207
-
208
-
209
-
210
-
211
-
212
-
213
-
214
-
215
-
216
-
217
-
218
-
219
-
220
-
221
-
222
-
223
-
224
-
225
-
226
-
227
-
228
-
229
-
230
-
231
-
232
-
233
-
234
-
235
-
236
-
237
-
238
-
239
-
240
-
241
-
242
-
243
-
244
-
245
-
246
-
247
-
248
-
249
-
250
 |
 |
124
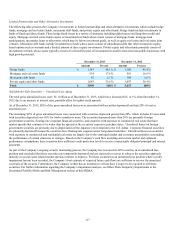
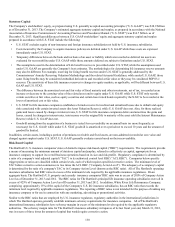
HLIKK has four revolving credit facilities in support of operations. Two of the credit facilities have no amounts drawn as of
December 31, 2013 with borrowing limits of approximately ¥5 billion, or $48 each, and individually have expiration dates of January 5,
2015 and September 30, 2014. In December 2013, HLIKK entered into two new revolving credit facility agreements with two Japanese
banks in order to finance certain withholding taxes on mutual fund gains, that are subsequently credited when HLIKK files its’ income
tax returns. At December 31, 2013, HLIKK had drawn the total borrowing limits of ¥5 billion, or $48, and ¥20 billion, or $190 on these
credit facilities. The ¥5 billion credit facility accrues interest at a variable rate based on the one month Tokyo Interbank Offering Rate
(TIBOR) plus 3 bps, which as of December 31, 2013 the interest rate was 15 bps, and the ¥20 billion credit facility accrues interest at a
variable rate based on TIBOR plus 3 bps, or the actual cost of funding, which as of December 31, 2013 the interest rate was 20 bps.
Both of the credit facilities expire on September 30, 2014.
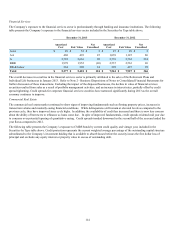
Derivative Commitments
Certain of the Company’s derivative agreements contain provisions that are tied to the financial strength ratings of the individual legal
entity that entered into the derivative agreement as set by nationally recognized statistical rating agencies. If the legal entity’s financial
strength were to fall below certain ratings, the counterparties to the derivative agreements could demand immediate and ongoing full
collateralization and in certain instances demand immediate settlement of all outstanding derivative positions traded under each
impacted bilateral agreement. The settlement amount is determined by netting the derivative positions transacted under each agreement.
If the termination rights were to be exercised by the counterparties, it could impact the legal entity’s ability to conduct hedging activities
by increasing the associated costs and decreasing the willingness of counterparties to transact with the legal entity. The aggregate fair
value of all derivative instruments with credit-risk-related contingent features that are in a net liability position as of December 31, 2013
was $1.2 billion. Of this $1.2 billion the legal entities have posted collateral of $1.4 billion in the normal course of business. In addition,
the Company has posted collateral of $44 associated with a customized GMWB derivative. Based on derivative market values as of
December 31, 2013, a downgrade of one level below the current financial strength ratings by either Moody’s or S&P could require
approximately an additional $12 to be posted as collateral. Based on derivative market values as of December 31, 2013, a downgrade by
either Moody’s or S&P of two levels below the legal entities’ current financial strength ratings could require approximately an additional
$33 of assets to be posted as collateral. These collateral amounts could change as derivative market values change, as a result of changes
in our hedging activities or to the extent changes in contractual terms are negotiated. The nature of the collateral that we would post, if
required, would be primarily in the form of U.S. Treasury bills, U.S. Treasury notes and government agency securities.
As of December 31, 2013, the aggregate notional amount and fair value of derivative relationships that could be subject to immediate
termination in the event of rating agency downgrades to either BBB+ or Baa1 was $536 and $(17), respectively.
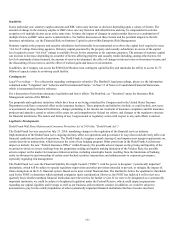
Insurance Operations
Current and expected patterns of claim frequency and severity or surrenders may change from period to period but continue to be within
historical norms and, therefore, the Company’s insurance operations’ current liquidity position is considered to be sufficient to meet
anticipated demands over the next twelve months, including any obligations related to the Company’s restructuring activities. For a
discussion and tabular presentation of the Company’s current contractual obligations by period, refer to Off-Balance Sheet Arrangements
and Aggregate Contractual Obligations within the Capital Resources and Liquidity section of the MD&A.
The principal sources of operating funds are premiums, fees earned from assets under management and investment income, while
investing cash flows originate from maturities and sales of invested assets. The primary uses of funds are to pay claims, claim
adjustment expenses, commissions and other underwriting expenses, to purchase new investments and to make dividend payments to the
HFSG Holding Company.
The Company’s insurance operations consist of property and casualty insurance products (collectively referred to as “Property &
Casualty Operations”) and life insurance and legacy annuity products (collectively referred to as “Life Operations”).
Property & Casualty Operations
Property & Casualty Operations holds fixed maturity securities including a significant short-term investment position (securities with
maturities of one year or less at the time of purchase) to meet liquidity needs.
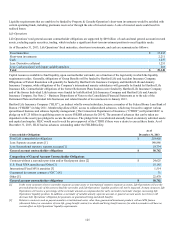
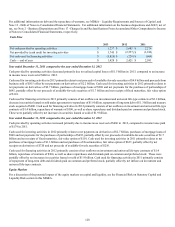
As of December 31, 2013, Property & Casualty Operations’ fixed maturities, short-term investments, and cash are summarized as
follows:
Fixed maturities $ 24,704
Short-term investments 984
Cash 189
Less: Derivative collateral 241
Total $ 25,636