The Hartford 2013 Annual Report Download - page 165
Download and view the complete annual report
Please find page 165 of the 2013 The Hartford annual report below. You can navigate through the pages in the report by either clicking on the pages listed below, or by using the keyword search tool below to find specific information within the annual report.-
 1
1 -
2
-
3
-
4
-
5
-
6
-
7
-
8
-
9
-
10
-
11
-
12
-
13
-
14
-
15
-
16
-
17
-
18
-
19
-
20
-
21
-
22
-
23
-
24
-
25
-
26
-
27
-
28
-
29
-
30
-
31
-
32
-
33
-
34
-
35
-
36
-
37
-
38
-
39
-
40
-
41
-
42
-
43
-
44
-
45
-
46
-
47
-
48
-
49
-
50
-
51
-
52
-
53
-
54
-
55
-
56
-
57
-
58
-
59
-
60
-
61
-
62
-
63
-
64
-
65
-
66
-
67
-
68
-
69
-
70
-
71
-
72
-
73
-
74
-
75
-
76
-
77
-
78
-
79
-
80
-
81
-
82
-
83
-
84
-
85
-
86
-
87
-
88
-
89
-
90
-
91
-
92
-
93
-
94
-
95
-
96
-
97
-
98
-
99
-
100
-
101
-
102
-
103
-
104
-
105
-
106
-
107
-
108
-
109
-
110
-
111
-
112
-
113
-
114
-
115
-
116
-
117
-
118
-
119
-
120
-
121
-
122
-
123
-
124
-
125
-
126
-
127
-
128
-
129
-
130
-
131
-
132
-
133
-
134
-
135
-
136
-
137
-
138
-
139
-
140
-
141
-
142
-
143
-
144
-
145
-
146
-
147
-
148
-
149
-
150
-
151
-
152
-
153
-
154
-
 155
155 -
 156
156 -
 157
157 -
 158
158 -
 159
159 -
 160
160 -
 161
161 -
 162
162 -
 163
163 -
 164
164 -
 165
165 -
 166
166 -
 167
167 -
 168
168 -
 169
169 -
 170
170 -
 171
171 -
 172
172 -
 173
173 -
 174
174 -
 175
175 -
176
-
177
-
178
-
179
-
180
-
181
-
182
-
183
-
184
-
185
-
186
-
187
-
188
-
189
-
190
-
191
-
192
-
193
-
194
-
195
-
196
-
197
-
198
-
199
-
200
-
201
-
202
-
203
-
204
-
205
-
206
-
207
-
208
-
209
-
210
-
211
-
212
-
213
-
214
-
215
-
216
-
217
-
218
-
219
-
220
-
221
-
222
-
223
-
224
-
225
-
226
-
227
-
228
-
229
-
230
-
231
-
232
-
233
-
234
-
235
-
236
-
237
-
238
-
239
-
240
-
241
-
242
-
243
-
244
-
245
-
246
-
247
-
248
-
249
-
250
 |
 |
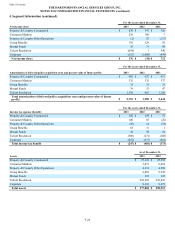
F-29
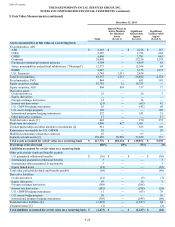
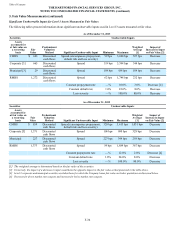
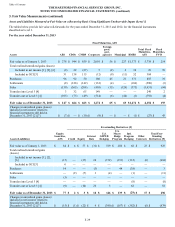
December 31, 2012
Total
Quoted Prices in
Active Markets
for Identical
Assets
(Level 1)
Significant
Observable
Inputs
(Level 2)
Significant
Unobservable
Inputs
(Level 3)
Assets accounted for at fair value on a recurring basis
Fixed maturities, AFS
ABS $ 2,763 $ — $ 2,485 $ 278
CDOs 3,040 — 2,096 944
CMBS 6,321 — 5,462 859
Corporate 44,049 — 42,048 2,001
Foreign government/government agencies 4,136 — 4,080 56
Municipal 14,361 — 14,134 227
RMBS 7,480 — 6,107 1,373
U.S. Treasuries 3,772 115 3,657 —
Total fixed maturities 85,922 115 80,069 5,738
Fixed maturities, FVO 1,087 8 865 214
Equity securities, trading 28,933 1,847 27,086 —
Equity securities, AFS 890 337 469 84
Derivative assets
Credit derivatives (19) — (8) (11)
Equity derivatives 32 — — 32
Foreign exchange derivatives 104 — 104 —
Interest rate derivatives 235 — 268 (33)
U.S. GMWB hedging instruments 36 — (53) 89
U.S. macro hedge program 186 — — 186
International program hedging instruments 448 — 318 130
Other derivative contracts 23 — — 23
Total derivative assets [1] 1,045 — 629 416
Short-term investments 4,581 342 4,239 —
Limited partnerships and other alternative investments [2] 907 — 593 314
Reinsurance recoverable for U.S. GMWB 191 — — 191
Separate account assets [3] 138,509 97,988 39,938 583
Total assets accounted for at fair value on a recurring basis $ 262,065 $ 100,637 $ 153,888 $ 7,540
Percentage of level to total 100% 38% 59% 3%
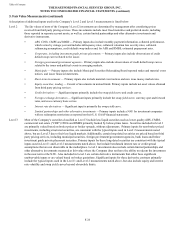
Table of Contents THE HARTFORD FINANCIAL SERVICES GROUP, INC.
NOTES TO CONSOLIDATED FINANCIAL STATEMENTS (continued)
5. Fair Value Measurements (continued)