The Hartford 2013 Annual Report Download - page 158
Download and view the complete annual report
Please find page 158 of the 2013 The Hartford annual report below. You can navigate through the pages in the report by either clicking on the pages listed below, or by using the keyword search tool below to find specific information within the annual report.-
 1
1 -
2
-
3
-
4
-
5
-
6
-
7
-
8
-
9
-
10
-
11
-
12
-
13
-
14
-
15
-
16
-
17
-
18
-
19
-
20
-
21
-
22
-
23
-
24
-
25
-
26
-
27
-
28
-
29
-
30
-
31
-
32
-
33
-
34
-
35
-
36
-
37
-
38
-
39
-
40
-
41
-
42
-
43
-
44
-
45
-
46
-
47
-
48
-
49
-
50
-
51
-
52
-
53
-
54
-
55
-
56
-
57
-
58
-
59
-
60
-
61
-
62
-
63
-
64
-
65
-
66
-
67
-
68
-
69
-
70
-
71
-
72
-
73
-
74
-
75
-
76
-
77
-
78
-
79
-
80
-
81
-
82
-
83
-
84
-
85
-
86
-
87
-
88
-
89
-
90
-
91
-
92
-
93
-
94
-
95
-
96
-
97
-
98
-
99
-
100
-
101
-
102
-
103
-
104
-
105
-
106
-
107
-
108
-
109
-
110
-
111
-
112
-
113
-
114
-
115
-
116
-
117
-
118
-
119
-
120
-
121
-
122
-
123
-
124
-
125
-
126
-
127
-
128
-
129
-
130
-
131
-
132
-
133
-
134
-
135
-
136
-
137
-
138
-
139
-
140
-
141
-
142
-
143
-
144
-
145
-
146
-
147
-
 148
148 -
 149
149 -
 150
150 -
 151
151 -
 152
152 -
 153
153 -
 154
154 -
 155
155 -
 156
156 -
 157
157 -
 158
158 -
 159
159 -
 160
160 -
 161
161 -
 162
162 -
 163
163 -
 164
164 -
 165
165 -
 166
166 -
 167
167 -
 168
168 -
169
-
170
-
171
-
172
-
173
-
174
-
175
-
176
-
177
-
178
-
179
-
180
-
181
-
182
-
183
-
184
-
185
-
186
-
187
-
188
-
189
-
190
-
191
-
192
-
193
-
194
-
195
-
196
-
197
-
198
-
199
-
200
-
201
-
202
-
203
-
204
-
205
-
206
-
207
-
208
-
209
-
210
-
211
-
212
-
213
-
214
-
215
-
216
-
217
-
218
-
219
-
220
-
221
-
222
-
223
-
224
-
225
-
226
-
227
-
228
-
229
-
230
-
231
-
232
-
233
-
234
-
235
-
236
-
237
-
238
-
239
-
240
-
241
-
242
-
243
-
244
-
245
-
246
-
247
-
248
-
249
-
250
 |
 |

F-22
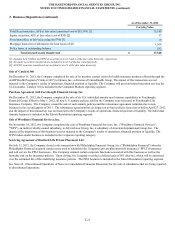
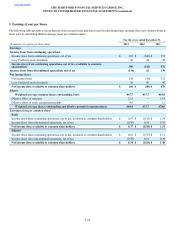
3. Earnings (Loss) per Share
The following table presents a reconciliation of net income (loss) and shares used in calculating basic earnings (loss) per common share to
those used in calculating diluted earnings (loss) per common share.
For the years ended December 31,
(In millions, except for per share data) 2013 2012 2011
Earnings
Income (loss) from continuing operations
Income (loss) from continuing operations, net of tax $ 310 $ (100) $ 573
Less: Preferred stock dividends 10 42 42
Income (loss) from continuing operations, net of tax, available to common
shareholders 300 (142) 531
Income (loss) from discontinued operations, net of tax (134) 62 139
Net income (loss)
Net income (loss) 176 (38) 712
Less: Preferred stock dividends 10 42 42
Net income (loss) available to common shareholders $ 166 $ (80) $ 670
Shares
Weighted average common shares outstanding, basic 447.7 437.7 445.0
Dilutive effect of warrants 32.2 — 31.9
Dilutive effect of stock compensation plans 4.5 — 1.1
Weighted average shares outstanding and dilutive potential common shares 484.4 437.7 478.0
Earnings (loss) per common share
Basic
Income (loss) from continuing operations, net of tax, available to common shareholders $ 0.67 $ (0.32) $ 1.19
Income (loss) from discontinued operations, net of tax (0.30) 0.14 0.32
Net income (loss) available to common shareholders $ 0.37 $ (0.18) $ 1.51
Diluted
Income (loss) from continuing operations, net of tax, available to common shareholders $ 0.62 $ (0.32) $ 1.11
Income (loss) from discontinued operations, net of tax (0.28) 0.14 0.29
Net income (loss) available to common shareholders $ 0.34 $ (0.18) $ 1.40
Table of Contents THE HARTFORD FINANCIAL SERVICES GROUP, INC.
NOTES TO CONSOLIDATED FINANCIAL STATEMENTS (continued)