The Hartford 2013 Annual Report Download - page 186
Download and view the complete annual report
Please find page 186 of the 2013 The Hartford annual report below. You can navigate through the pages in the report by either clicking on the pages listed below, or by using the keyword search tool below to find specific information within the annual report.-
 1
1 -
2
-
3
-
4
-
5
-
6
-
7
-
8
-
9
-
10
-
11
-
12
-
13
-
14
-
15
-
16
-
17
-
18
-
19
-
20
-
21
-
22
-
23
-
24
-
25
-
26
-
27
-
28
-
29
-
30
-
31
-
32
-
33
-
34
-
35
-
36
-
37
-
38
-
39
-
40
-
41
-
42
-
43
-
44
-
45
-
46
-
47
-
48
-
49
-
50
-
51
-
52
-
53
-
54
-
55
-
56
-
57
-
58
-
59
-
60
-
61
-
62
-
63
-
64
-
65
-
66
-
67
-
68
-
69
-
70
-
71
-
72
-
73
-
74
-
75
-
76
-
77
-
78
-
79
-
80
-
81
-
82
-
83
-
84
-
85
-
86
-
87
-
88
-
89
-
90
-
91
-
92
-
93
-
94
-
95
-
96
-
97
-
98
-
99
-
100
-
101
-
102
-
103
-
104
-
105
-
106
-
107
-
108
-
109
-
110
-
111
-
112
-
113
-
114
-
115
-
116
-
117
-
118
-
119
-
120
-
121
-
122
-
123
-
124
-
125
-
126
-
127
-
128
-
129
-
130
-
131
-
132
-
133
-
134
-
135
-
136
-
137
-
138
-
139
-
140
-
141
-
142
-
143
-
144
-
145
-
146
-
147
-
148
-
149
-
150
-
151
-
152
-
153
-
154
-
155
-
156
-
157
-
158
-
159
-
160
-
161
-
162
-
163
-
164
-
165
-
166
-
167
-
168
-
169
-
170
-
171
-
172
-
173
-
174
-
175
-
 176
176 -
 177
177 -
 178
178 -
 179
179 -
 180
180 -
 181
181 -
 182
182 -
 183
183 -
 184
184 -
 185
185 -
 186
186 -
 187
187 -
 188
188 -
 189
189 -
 190
190 -
 191
191 -
 192
192 -
 193
193 -
 194
194 -
 195
195 -
 196
196 -
197
-
198
-
199
-
200
-
201
-
202
-
203
-
204
-
205
-
206
-
207
-
208
-
209
-
210
-
211
-
212
-
213
-
214
-
215
-
216
-
217
-
218
-
219
-
220
-
221
-
222
-
223
-
224
-
225
-
226
-
227
-
228
-
229
-
230
-
231
-
232
-
233
-
234
-
235
-
236
-
237
-
238
-
239
-
240
-
241
-
242
-
243
-
244
-
245
-
246
-
247
-
248
-
249
-
250
 |
 |
F-50
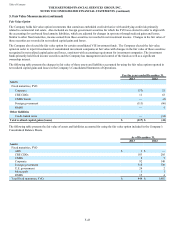
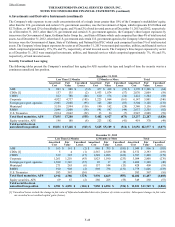
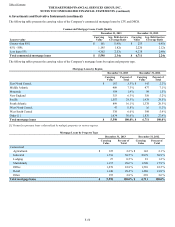
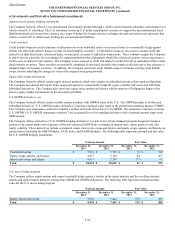
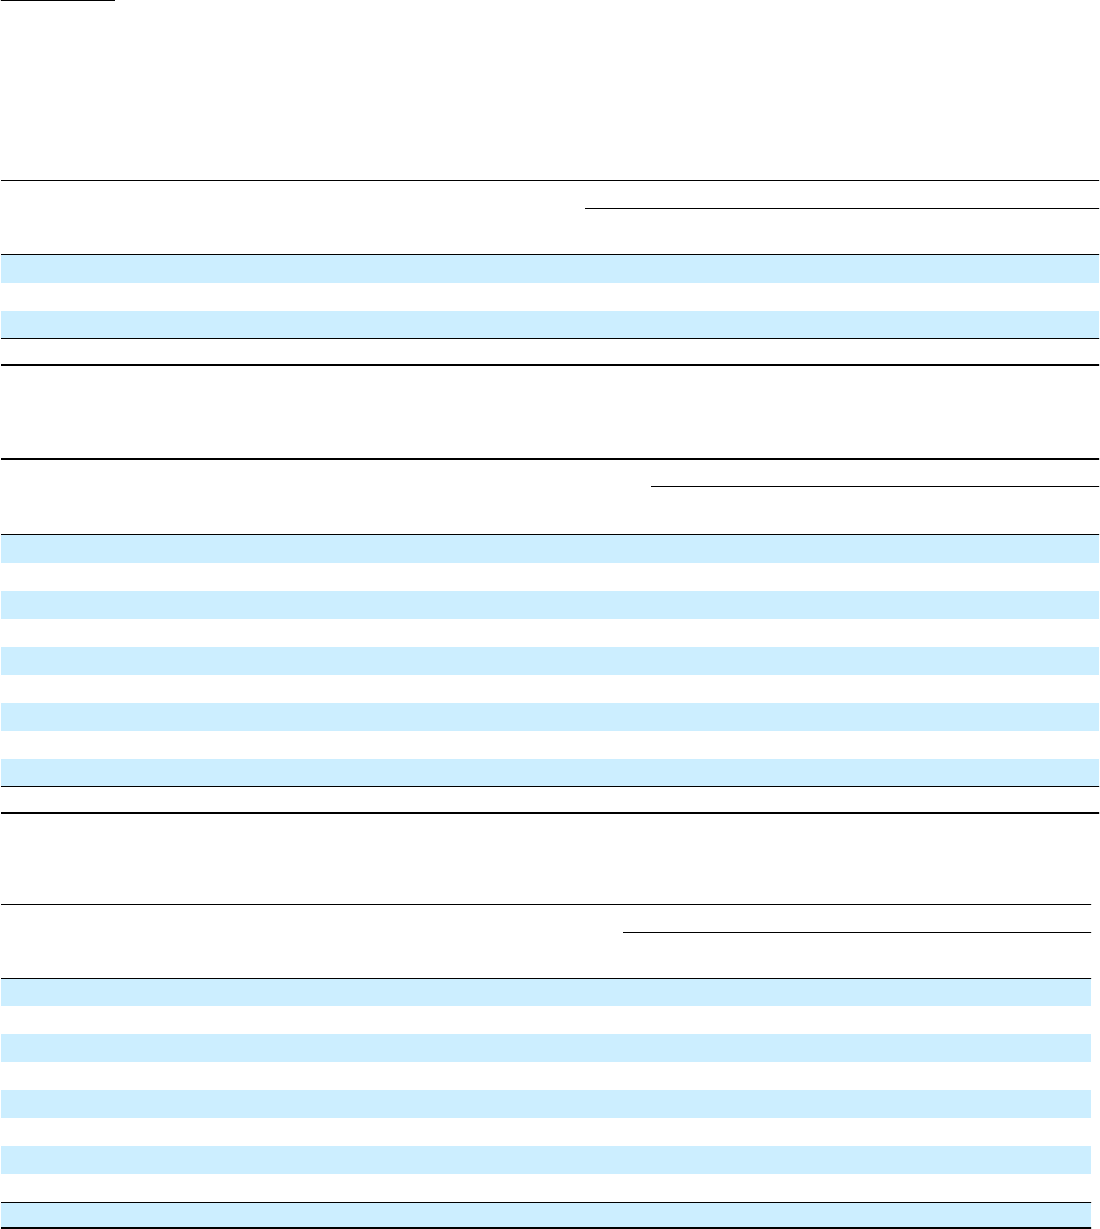
The following table presents the carrying value of the Company’s commercial mortgage loans by LTV and DSCR.
Commercial Mortgage Loans Credit Quality
December 31, 2013 December 31, 2012
Loan-to-value Carrying
Value Avg. Debt-Service
Coverage Ratio Carrying
Value Avg. Debt-Service
Coverage Ratio
Greater than 80% $ 101 0.99x $ 253 0.95x
65% - 80% 1,195 1.82x 2,220 2.12x
Less than 65% 4,302 2.53x 4,238 2.40x
Total commercial mortgage loans $ 5,598 2.34x $ 6,711 2.24x
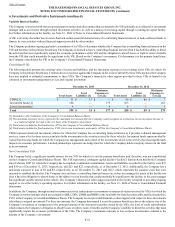
The following tables present the carrying value of the Company’s mortgage loans by region and property type.
Mortgage Loans by Region
December 31, 2013 December 31, 2012
Carrying
Value Percent of
Total Carrying
Value Percent of
Total
East North Central $ 187 3.3% $ 145 2.2 %
Middle Atlantic 409 7.3 % 477 7.1 %
Mountain 104 1.9 % 99 1.5 %
New England 353 6.3 % 350 5.2 %
Pacific 1,587 28.3 % 1,978 29.5 %
South Atlantic 899 16.1 % 1,378 20.5 %
West North Central 47 0.8 % 16 0.2 %
West South Central 338 6.0 % 398 5.9 %
Other [1] 1,674 30.0 % 1,870 27.9 %
Total mortgage loans $ 5,598 100.0% $ 6,711 100.0%
[1] Primarily represents loans collateralized by multiple properties in various regions.
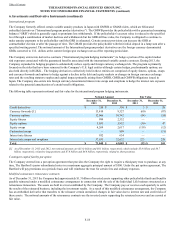
Mortgage Loans by Property Type
December 31, 2013 December 31, 2012
Carrying
Value Percent of
Total Carrying
Value Percent of
Total
Commercial
Agricultural $ 125 2.2 % $ 142 2.1 %
Industrial 1,718 30.7 % 2,079 30.9 %
Lodging 27 0.5 % 81 1.2 %
Multifamily 1,155 20.6 % 1,200 17.9 %
Office 1,278 22.8 % 1,510 22.5 %
Retail 1,140 20.4 % 1,460 21.8 %
Other 155 2.8 % 239 3.6 %
Total mortgage loans $ 5,598 100.0% $ 6,711 100.0%
Table of Contents THE HARTFORD FINANCIAL SERVICES GROUP, INC.
NOTES TO CONSOLIDATED FINANCIAL STATEMENTS (continued)
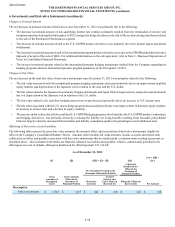
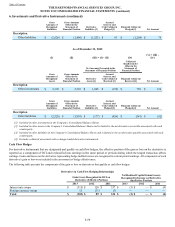
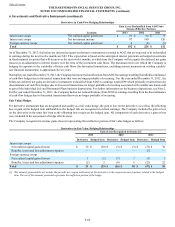
6. Investments and Derivative Instruments (continued)