The Hartford 2013 Annual Report Download - page 59
Download and view the complete annual report
Please find page 59 of the 2013 The Hartford annual report below. You can navigate through the pages in the report by either clicking on the pages listed below, or by using the keyword search tool below to find specific information within the annual report.-
 1
1 -
2
-
3
-
4
-
5
-
6
-
7
-
8
-
9
-
10
-
11
-
12
-
13
-
14
-
15
-
16
-
17
-
18
-
19
-
20
-
21
-
22
-
23
-
24
-
25
-
26
-
27
-
28
-
29
-
30
-
31
-
32
-
33
-
34
-
35
-
36
-
37
-
38
-
39
-
40
-
41
-
42
-
43
-
44
-
45
-
46
-
47
-
48
-
 49
49 -
 50
50 -
 51
51 -
 52
52 -
 53
53 -
 54
54 -
 55
55 -
 56
56 -
 57
57 -
 58
58 -
 59
59 -
 60
60 -
 61
61 -
 62
62 -
 63
63 -
 64
64 -
 65
65 -
 66
66 -
 67
67 -
 68
68 -
 69
69 -
70
-
71
-
72
-
73
-
74
-
75
-
76
-
77
-
78
-
79
-
80
-
81
-
82
-
83
-
84
-
85
-
86
-
87
-
88
-
89
-
90
-
91
-
92
-
93
-
94
-
95
-
96
-
97
-
98
-
99
-
100
-
101
-
102
-
103
-
104
-
105
-
106
-
107
-
108
-
109
-
110
-
111
-
112
-
113
-
114
-
115
-
116
-
117
-
118
-
119
-
120
-
121
-
122
-
123
-
124
-
125
-
126
-
127
-
128
-
129
-
130
-
131
-
132
-
133
-
134
-
135
-
136
-
137
-
138
-
139
-
140
-
141
-
142
-
143
-
144
-
145
-
146
-
147
-
148
-
149
-
150
-
151
-
152
-
153
-
154
-
155
-
156
-
157
-
158
-
159
-
160
-
161
-
162
-
163
-
164
-
165
-
166
-
167
-
168
-
169
-
170
-
171
-
172
-
173
-
174
-
175
-
176
-
177
-
178
-
179
-
180
-
181
-
182
-
183
-
184
-
185
-
186
-
187
-
188
-
189
-
190
-
191
-
192
-
193
-
194
-
195
-
196
-
197
-
198
-
199
-
200
-
201
-
202
-
203
-
204
-
205
-
206
-
207
-
208
-
209
-
210
-
211
-
212
-
213
-
214
-
215
-
216
-
217
-
218
-
219
-
220
-
221
-
222
-
223
-
224
-
225
-
226
-
227
-
228
-
229
-
230
-
231
-
232
-
233
-
234
-
235
-
236
-
237
-
238
-
239
-
240
-
241
-
242
-
243
-
244
-
245
-
246
-
247
-
248
-
249
-
250
 |
 |
59
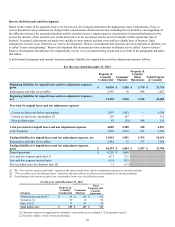
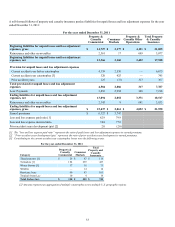
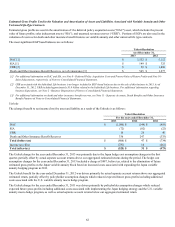
Impact of Re-estimates
The establishment of property and casualty insurance product reserves is an estimation process, using a variety of methods, assumptions
and data elements. Ultimate losses may vary materially from the current estimates. Many factors can contribute to these variations and
the need to change the previous estimate of required reserve levels. Subsequent changes can generally be thought of as being the result
of the emergence of additional facts that were not known or anticipated at the time of the prior reserve estimate and/or changes in
interpretations of information and trends.
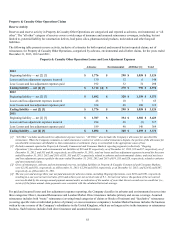
The table below shows the range of annual reserve re-estimates experienced by The Hartford over the past ten years. The amount of
prior accident year development (as shown in the reserve rollforward) for a given calendar year is expressed as a percent of the
beginning calendar year reserves, net of reinsurance. The percentage relationships presented are significantly influenced by the facts and
circumstances of each particular year and by the fact that only the last ten years are included in the range. Accordingly, these percentages
are not intended to be a prediction of the range of possible future variability. See “Impact of key assumptions on reserve volatility”
within this section for further discussion of the potential for variability in recorded loss reserves.
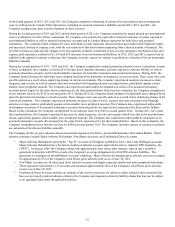
Property & Casualty
Commercial Consumer
Markets
Property &
Casualty Other
Operations Total Property
& Casualty [1]
Range of prior accident year unfavorable
(favorable) development for the ten years
ended December 31, 2013 (3.1)% - 1.5% (6.9)% - 0.2% 1.9% - 9.3% (1.2)% - 2.6%
[1] Excluding the reserve strengthening for asbestos and environmental reserves, over the past ten years reserve re-estimates for total property and
casualty insurance ranged from (2.5)% to 1.0%.
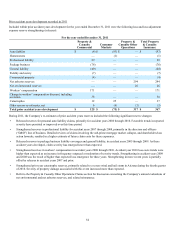
The potential variability of the Company’s property and casualty insurance product reserves would normally be expected to vary by
segment and the types of loss exposures insured by those segments. Illustrative factors influencing the potential reserve variability for
each of the segments are discussed above.
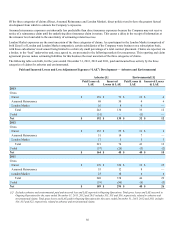
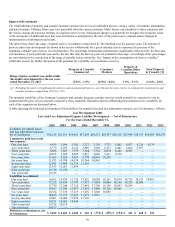
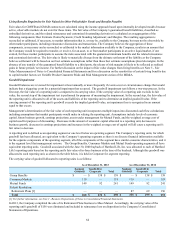
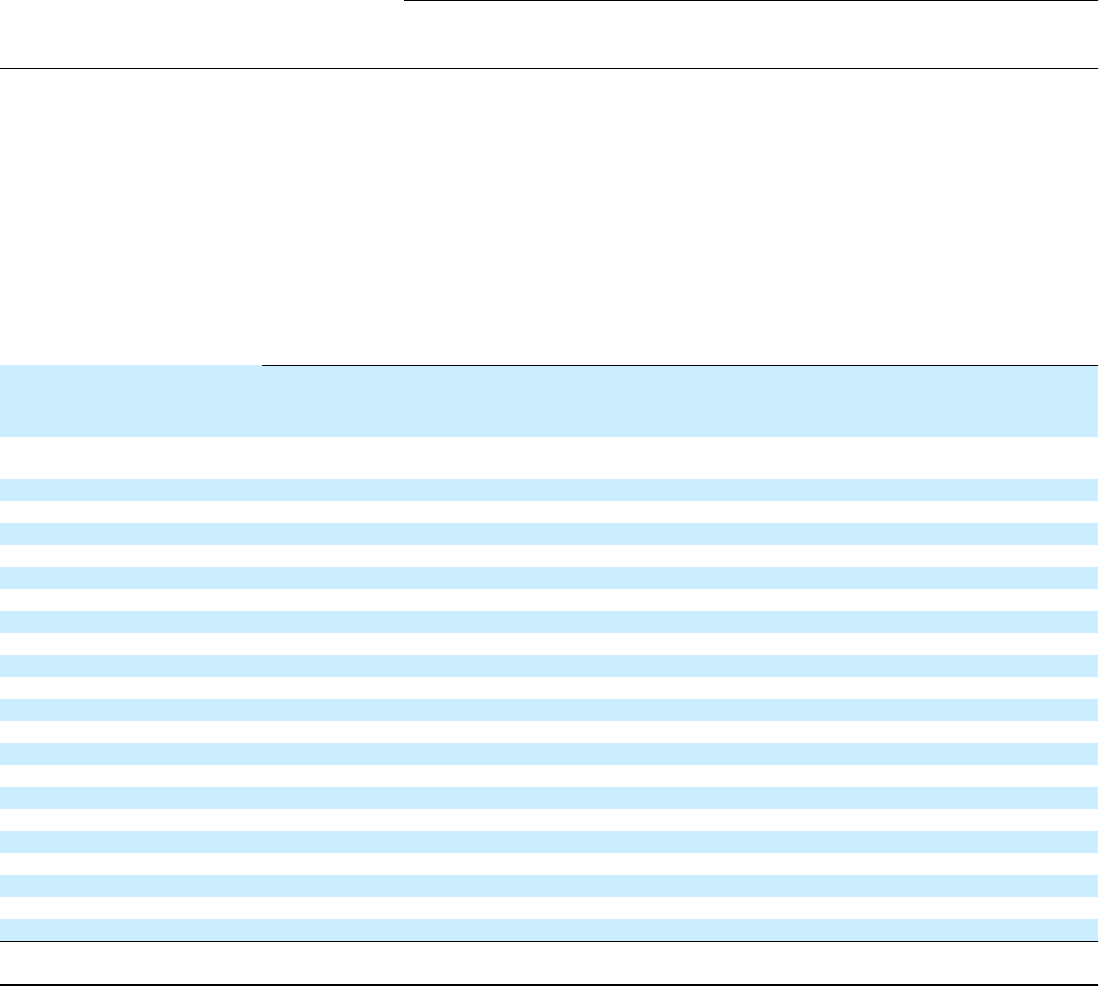
A table depicting the historical development of the liabilities for unpaid losses and loss adjustment expenses, net of reinsurance, follows:
Loss Development Table
Loss And Loss Adjustment Expense Liability Development — Net of Reinsurance
For the Years Ended December 31,
2003 2004 2005 2006 2007 2008 2009 2010 2011 2012 2013
Liabilities for unpaid losses
and loss adjustment expenses,
net of reinsurance $16,218 $16,191 $16,863 $17,604 $18,231 $18,347 $18,210 $17,948 $18,517 $18,689 $18,676
Cumulative paid losses and
loss expenses
One year later 4,415 3,594 3,702 3,727 3,703 3,771 3,882 4,037 4,216 4,274
Two years later 6,779 6,035 6,122 5,980 5,980 6,273 6,401 6,664 6,897 —
Three years later 8,686 7,825 7,755 7,544 7,752 8,074 8,241 8,503 — —
Four years later 10,075 9,045 8,889 8,833 9,048 9,411 9,538 — — —
Five years later 11,063 9,928 9,903 9,778 10,061 10,395 — — — —
Six years later 11,821 10,798 10,674 10,564 10,845 — — — — —
Seven years later 12,601 11,448 11,334 11,216 — — — — — —
Eight years later 13,193 12,023 11,895 — — — — — — —
Nine years later 13,718 12,526 — — — — — — — —
Ten years later 14,186 — — — — — — — — —
Liabilities re-estimated
One year later 16,632 16,439 17,159 17,652 18,005 18,161 18,014 18,315 18,513 18,881
Two years later 17,232 16,838 17,347 17,475 17,858 18,004 18,136 18,275 18,686 —
Three years later 17,739 17,240 17,318 17,441 17,700 18,139 18,093 18,299 — —
Four years later 18,367 17,344 17,497 17,439 17,866 18,120 18,056 — — —
Five years later 18,554 17,570 17,613 17,676 17,848 18,092 — — — —
Six years later 18,836 17,777 17,895 17,673 17,857 — — — — —
Seven years later 19,063 18,064 17,899 17,749 — — — — — —
Eight years later 19,351 18,062 18,045 — — — — — — —
Nine years later 19,358 18,214 — — — — — — — —
Ten years later 19,517 — — — — — — — — —
Deficiency (redundancy), net
of reinsurance $ 3,299 $ 2,023 $ 1,182 $ 145 $ (374) $ (255) $ (154) $ 351 $ 169 $ 192