The Hartford 2013 Annual Report Download - page 167
Download and view the complete annual report
Please find page 167 of the 2013 The Hartford annual report below. You can navigate through the pages in the report by either clicking on the pages listed below, or by using the keyword search tool below to find specific information within the annual report.-
 1
1 -
2
-
3
-
4
-
5
-
6
-
7
-
8
-
9
-
10
-
11
-
12
-
13
-
14
-
15
-
16
-
17
-
18
-
19
-
20
-
21
-
22
-
23
-
24
-
25
-
26
-
27
-
28
-
29
-
30
-
31
-
32
-
33
-
34
-
35
-
36
-
37
-
38
-
39
-
40
-
41
-
42
-
43
-
44
-
45
-
46
-
47
-
48
-
49
-
50
-
51
-
52
-
53
-
54
-
55
-
56
-
57
-
58
-
59
-
60
-
61
-
62
-
63
-
64
-
65
-
66
-
67
-
68
-
69
-
70
-
71
-
72
-
73
-
74
-
75
-
76
-
77
-
78
-
79
-
80
-
81
-
82
-
83
-
84
-
85
-
86
-
87
-
88
-
89
-
90
-
91
-
92
-
93
-
94
-
95
-
96
-
97
-
98
-
99
-
100
-
101
-
102
-
103
-
104
-
105
-
106
-
107
-
108
-
109
-
110
-
111
-
112
-
113
-
114
-
115
-
116
-
117
-
118
-
119
-
120
-
121
-
122
-
123
-
124
-
125
-
126
-
127
-
128
-
129
-
130
-
131
-
132
-
133
-
134
-
135
-
136
-
137
-
138
-
139
-
140
-
141
-
142
-
143
-
144
-
145
-
146
-
147
-
148
-
149
-
150
-
151
-
152
-
153
-
154
-
155
-
156
-
 157
157 -
 158
158 -
 159
159 -
 160
160 -
 161
161 -
 162
162 -
 163
163 -
 164
164 -
 165
165 -
 166
166 -
 167
167 -
 168
168 -
 169
169 -
 170
170 -
 171
171 -
 172
172 -
 173
173 -
 174
174 -
 175
175 -
 176
176 -
 177
177 -
178
-
179
-
180
-
181
-
182
-
183
-
184
-
185
-
186
-
187
-
188
-
189
-
190
-
191
-
192
-
193
-
194
-
195
-
196
-
197
-
198
-
199
-
200
-
201
-
202
-
203
-
204
-
205
-
206
-
207
-
208
-
209
-
210
-
211
-
212
-
213
-
214
-
215
-
216
-
217
-
218
-
219
-
220
-
221
-
222
-
223
-
224
-
225
-
226
-
227
-
228
-
229
-
230
-
231
-
232
-
233
-
234
-
235
-
236
-
237
-
238
-
239
-
240
-
241
-
242
-
243
-
244
-
245
-
246
-
247
-
248
-
249
-
250
 |
 |
F-31
The Company also has an enterprise-wide Operational Risk Management function, led by the Chief Operational Risk Officer, which is
responsible for establishing, maintaining and communicating the framework, principles and guidelines of the Company's operational risk
management program. This includes model risk management which provides an independent review of the suitability, characteristics and
reliability of model inputs; as well as, an analysis of significant changes to current models.
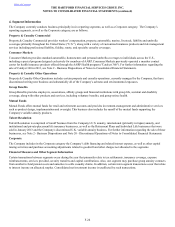
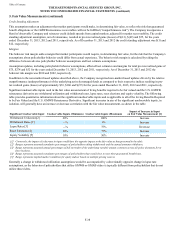
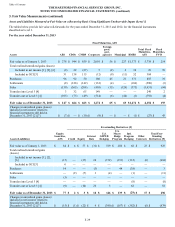
AFS Securities, Fixed Maturities, FVO, Equity Securities, Trading, and Short-term Investments
The fair value of AFS securities, fixed maturities, FVO, equity securities, trading, and short-term investments in an active and orderly
market (e.g. not distressed or forced liquidation) are determined by management after considering one of three primary sources of
information: third-party pricing services, independent broker quotations or pricing matrices. Security pricing is applied using a “waterfall”
approach whereby publicly available prices are first sought from third-party pricing services, the remaining unpriced securities are
submitted to independent brokers for prices, or lastly, securities are priced using a pricing matrix. If none of these pricing sources are
available, the Company will estimate fair value utilizing an internal pricing model. Typical inputs used by these pricing methods include,
but are not limited to, reported trades, benchmark yields, issuer spreads, bids, offers, and/or estimated cash flows, prepayments speeds
and default rates. Based on the typical trading volumes and the lack of quoted market prices for fixed maturities, third-party pricing
services will normally derive the security prices from recent reported trades for identical or similar securities making adjustments through
the reporting date based upon available market observable information as outlined above. If there are no recently reported trades, the third-
party pricing services and independent brokers may use matrix or model processes to develop a security price where future cash flow
expectations are developed based upon collateral performance and discounted at an estimated market rate. Included in the pricing of ABS
and RMBS are estimates of the rate of future prepayments of principal over the remaining life of the securities. Such estimates are derived
based on the characteristics of the underlying structure and prepayment speeds previously experienced at the interest rate levels projected
for the underlying collateral. Actual prepayment experience may vary from these estimates.
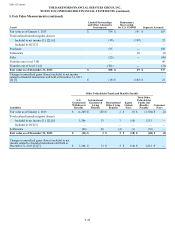
Prices from third-party pricing services are often unavailable for securities that are rarely traded or are traded only in privately negotiated
transactions. As a result, certain securities are priced via independent broker quotations which utilize inputs that may be difficult to
corroborate with observable market based data. Additionally, the majority of these independent broker quotations are non-binding.
A pricing matrix is used to price private placement securities for which the Company is unable to obtain a price from a third-party pricing
service by discounting the expected future cash flows from the security by a developed market discount rate utilizing current credit spreads.
Credit spreads are developed each month using market based data for public securities adjusted for credit spread differentials between
public and private securities which are obtained from a survey of multiple private placement brokers. The appropriate credit spreads
determined through this survey approach are based upon the issuer’s financial strength and term to maturity, utilizing an independent public
security index and trade information and adjusting for the non-public nature of the securities.
The Securities Working Group performs ongoing analysis of the prices and credit spreads received from third parties to ensure that the
prices represent a reasonable estimate of the fair value. This process involves quantitative and qualitative analysis and is overseen by
investment and accounting professionals. As a part of this analysis, the Company considers trading volume, new issuance activity and other
factors to determine whether the market activity is significantly different than normal activity in an active market, and if so, whether
transactions may not be orderly considering the weight of available evidence. If the available evidence indicates that pricing is based upon
transactions that are stale or not orderly, the Company places little, if any, weight on the transaction price and will estimate fair value
utilizing an internal pricing model. In addition, the Company ensures that prices received from independent brokers represent a reasonable
estimate of fair value through the use of internal and external cash flow models developed based on spreads, and when available, market
indices. As a result of this analysis, if the Company determines that there is a more appropriate fair value based upon the available market
data, the price received from the third party is adjusted accordingly and approved by the Valuation Committee. The Company’s internal
pricing model utilizes the Company’s best estimate of expected future cash flows discounted at a rate of return that a market participant
would require. The significant inputs to the model include, but are not limited to, current market inputs, such as credit loss assumptions,
estimated prepayment speeds and market risk premiums.
The Company conducts other specific activities to monitor controls around pricing. Daily analyses identify price changes over 3-5%, sale
trade prices that differ over 3% from the prior day’s price and purchase trade prices that differ more than 3% from the current day’s price.
Weekly analyses identify prices that differ more than 5% from published bond prices of a corporate bond index. Monthly analyses identify
price changes over 3%, prices that haven’t changed, missing prices and second source validation on most sectors. Analyses are conducted
by a dedicated pricing unit who follows up with trading and investment sector professionals and challenges prices with vendors when the
estimated assumptions used differ from what the Company feels a market participant would use. Any changes from the identified pricing
source are verified by further confirmation of assumptions used. Examples of other procedures performed include, but are not limited to,
initial and on-going review of third-party pricing services’ methodologies, review of pricing statistics and trends and back testing recent
trades.
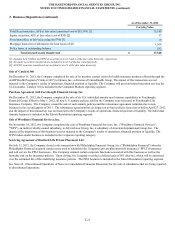
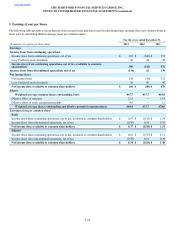
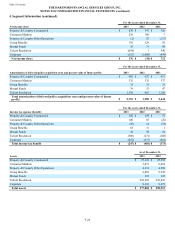
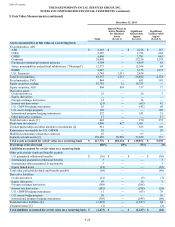
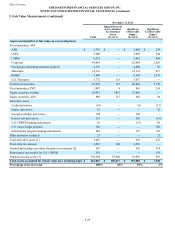
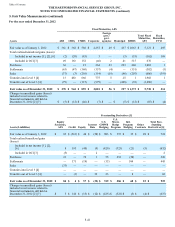
Table of Contents THE HARTFORD FINANCIAL SERVICES GROUP, INC.
NOTES TO CONSOLIDATED FINANCIAL STATEMENTS (continued)
5. Fair Value Measurements (continued)