The Hartford 2013 Annual Report Download - page 173
Download and view the complete annual report
Please find page 173 of the 2013 The Hartford annual report below. You can navigate through the pages in the report by either clicking on the pages listed below, or by using the keyword search tool below to find specific information within the annual report.-
 1
1 -
2
-
3
-
4
-
5
-
6
-
7
-
8
-
9
-
10
-
11
-
12
-
13
-
14
-
15
-
16
-
17
-
18
-
19
-
20
-
21
-
22
-
23
-
24
-
25
-
26
-
27
-
28
-
29
-
30
-
31
-
32
-
33
-
34
-
35
-
36
-
37
-
38
-
39
-
40
-
41
-
42
-
43
-
44
-
45
-
46
-
47
-
48
-
49
-
50
-
51
-
52
-
53
-
54
-
55
-
56
-
57
-
58
-
59
-
60
-
61
-
62
-
63
-
64
-
65
-
66
-
67
-
68
-
69
-
70
-
71
-
72
-
73
-
74
-
75
-
76
-
77
-
78
-
79
-
80
-
81
-
82
-
83
-
84
-
85
-
86
-
87
-
88
-
89
-
90
-
91
-
92
-
93
-
94
-
95
-
96
-
97
-
98
-
99
-
100
-
101
-
102
-
103
-
104
-
105
-
106
-
107
-
108
-
109
-
110
-
111
-
112
-
113
-
114
-
115
-
116
-
117
-
118
-
119
-
120
-
121
-
122
-
123
-
124
-
125
-
126
-
127
-
128
-
129
-
130
-
131
-
132
-
133
-
134
-
135
-
136
-
137
-
138
-
139
-
140
-
141
-
142
-
143
-
144
-
145
-
146
-
147
-
148
-
149
-
150
-
151
-
152
-
153
-
154
-
155
-
156
-
157
-
158
-
159
-
160
-
161
-
162
-
 163
163 -
 164
164 -
 165
165 -
 166
166 -
 167
167 -
 168
168 -
 169
169 -
 170
170 -
 171
171 -
 172
172 -
 173
173 -
 174
174 -
 175
175 -
 176
176 -
 177
177 -
 178
178 -
 179
179 -
 180
180 -
 181
181 -
 182
182 -
 183
183 -
184
-
185
-
186
-
187
-
188
-
189
-
190
-
191
-
192
-
193
-
194
-
195
-
196
-
197
-
198
-
199
-
200
-
201
-
202
-
203
-
204
-
205
-
206
-
207
-
208
-
209
-
210
-
211
-
212
-
213
-
214
-
215
-
216
-
217
-
218
-
219
-
220
-
221
-
222
-
223
-
224
-
225
-
226
-
227
-
228
-
229
-
230
-
231
-
232
-
233
-
234
-
235
-
236
-
237
-
238
-
239
-
240
-
241
-
242
-
243
-
244
-
245
-
246
-
247
-
248
-
249
-
250
 |
 |
F-37
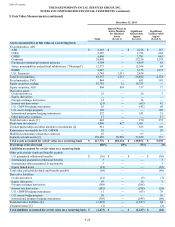
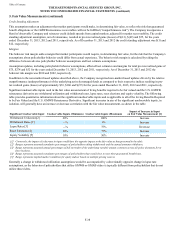
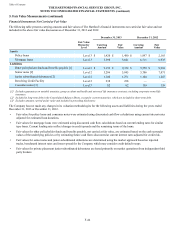
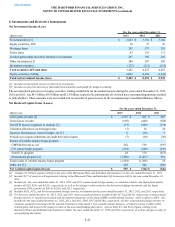
Separate Account Assets
Separate account assets are primarily invested in mutual funds. Other separate account assets include fixed maturities, limited
partnerships, equity securities, short-term investments and derivatives that are valued in the same manner, and using the same pricing
sources and inputs, as those investments held by the Company. Separate account assets classified as Level 3 primarily include limited
partnerships in which fair value represents the separate account's share of the fair value of the equity in the investment ("net asset value")
and are classified in level 3 based on the Company's ability to redeem its investments.
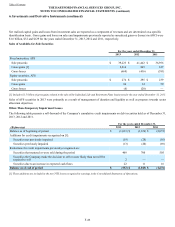
Living Benefits Required to be Fair Valued (in Other Policyholder Funds and Benefits Payable)
Living benefits required to be fair valued include U.S. GMWB, international GMWB and international other guaranteed living benefits.
Fair values for GMWB and guaranteed minimum accumulation benefit (“GMAB”) contracts are calculated using the income approach based
upon internally developed models because active, observable markets do not exist for those items. The fair value of the Company’s guaranteed
benefit liabilities, classified as embedded derivatives, and the related reinsurance and customized freestanding derivatives are calculated as an
aggregation of the following components: Best Estimate Claim Payments; Credit Standing Adjustment; and Margins. The resulting aggregation is
reconciled or calibrated, if necessary, to market information that is, or may be, available to the Company, but may not be observable by other
market participants, including reinsurance discussions and transactions. The Company believes the aggregation of these components, as
necessary and as reconciled or calibrated to the market information available to the Company, results in an amount that the Company would be
required to transfer or receive, for an asset, to or from market participants in an active liquid market, if one existed, for those market participants
to assume the risks associated with the guaranteed minimum benefits and the related reinsurance and customized derivatives. The fair value is
likely to materially diverge from the ultimate settlement of the liability as the Company believes settlement will be based on our best estimate
assumptions rather than those best estimate assumptions plus risk margins. In the absence of any transfer of the guaranteed benefit liability to a
third party, the release of risk margins is likely to be reflected as realized gains in future periods’ net income. Each component described below is
unobservable in the marketplace and require subjectivity by the Company in determining their value.
Oversight of the Company's valuation policies and processes for product and U.S. GMWB reinsurance derivatives is performed by a
multidisciplinary group comprised of finance, actuarial and risk management professionals. This multidisciplinary group reviews and
approves changes and enhancements to the Company's valuation model as well as associated controls.
Best Estimate
Claim Payments
The Best Estimate Claim Payments is calculated based on actuarial and capital market assumptions related to projected cash flows, including the
present value of benefits and related contract charges, over the lives of the contracts, incorporating expectations concerning policyholder
behavior such as lapses, fund selection, resets and withdrawal utilization. For the customized derivatives, policyholder behavior is prescribed in
the derivative contract. Because of the dynamic and complex nature of these cash flows, best estimate assumptions and a Monte Carlo stochastic
process is used in valuation. The Monte Carlo stochastic process involves the generation of thousands of scenarios that assume risk neutral
returns consistent with swap rates and a blend of observable implied index volatility levels. Estimating these cash flows involves numerous
estimates and subjective judgments regarding a number of variables —including expected market rates of return, market volatility, correlations of
market index returns to funds, fund performance, discount rates and assumptions about policyholder behavior which emerge over time.
At each valuation date, the Company assumes expected returns based on:
• risk-free rates as represented by the euro dollar futures, LIBOR deposits and swap rates to derive forward curve rates;
• market implied volatility assumptions for each underlying index based primarily on a blend of observed market “implied volatility” data;
• correlations of historical returns across underlying well known market indices based on actual observed returns over the ten years
preceding the valuation date; and
• three years of history for fund indexes compared to separate account fund regression.
On a daily basis, the Company updates capital market assumptions used in the GMWB liability model such as interest rates, equity indices and
the blend of implied equity index volatilities. The Company monitors various aspects of policyholder behavior and may modify certain of its
assumptions, including living benefit lapses and withdrawal rates, if credible emerging data indicates that changes are warranted. In addition, the
Company will continue to evaluate policyholder behavior assumptions as we begin to implement initiatives to reduce the size of the
variable annuity business. At a minimum, all policyholder behavior assumptions are reviewed and updated, as appropriate, in conjunction with
the completion of the Company’s comprehensive study to refine its estimate of future gross profits during the third quarter of each year.
Table of Contents THE HARTFORD FINANCIAL SERVICES GROUP, INC.
NOTES TO CONSOLIDATED FINANCIAL STATEMENTS (continued)
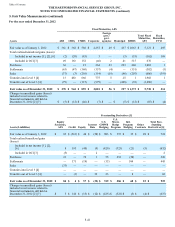
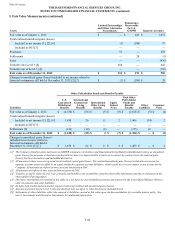
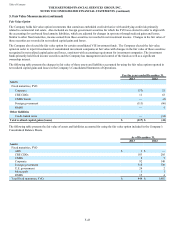
5. Fair Value Measurements (continued)