The Hartford 2013 Annual Report Download - page 201
Download and view the complete annual report
Please find page 201 of the 2013 The Hartford annual report below. You can navigate through the pages in the report by either clicking on the pages listed below, or by using the keyword search tool below to find specific information within the annual report.-
 1
1 -
2
-
3
-
4
-
5
-
6
-
7
-
8
-
9
-
10
-
11
-
12
-
13
-
14
-
15
-
16
-
17
-
18
-
19
-
20
-
21
-
22
-
23
-
24
-
25
-
26
-
27
-
28
-
29
-
30
-
31
-
32
-
33
-
34
-
35
-
36
-
37
-
38
-
39
-
40
-
41
-
42
-
43
-
44
-
45
-
46
-
47
-
48
-
49
-
50
-
51
-
52
-
53
-
54
-
55
-
56
-
57
-
58
-
59
-
60
-
61
-
62
-
63
-
64
-
65
-
66
-
67
-
68
-
69
-
70
-
71
-
72
-
73
-
74
-
75
-
76
-
77
-
78
-
79
-
80
-
81
-
82
-
83
-
84
-
85
-
86
-
87
-
88
-
89
-
90
-
91
-
92
-
93
-
94
-
95
-
96
-
97
-
98
-
99
-
100
-
101
-
102
-
103
-
104
-
105
-
106
-
107
-
108
-
109
-
110
-
111
-
112
-
113
-
114
-
115
-
116
-
117
-
118
-
119
-
120
-
121
-
122
-
123
-
124
-
125
-
126
-
127
-
128
-
129
-
130
-
131
-
132
-
133
-
134
-
135
-
136
-
137
-
138
-
139
-
140
-
141
-
142
-
143
-
144
-
145
-
146
-
147
-
148
-
149
-
150
-
151
-
152
-
153
-
154
-
155
-
156
-
157
-
158
-
159
-
160
-
161
-
162
-
163
-
164
-
165
-
166
-
167
-
168
-
169
-
170
-
171
-
172
-
173
-
174
-
175
-
176
-
177
-
178
-
179
-
180
-
181
-
182
-
183
-
184
-
185
-
186
-
187
-
188
-
189
-
190
-
 191
191 -
 192
192 -
 193
193 -
 194
194 -
 195
195 -
 196
196 -
 197
197 -
 198
198 -
 199
199 -
 200
200 -
 201
201 -
 202
202 -
 203
203 -
 204
204 -
 205
205 -
 206
206 -
 207
207 -
 208
208 -
 209
209 -
 210
210 -
 211
211 -
212
-
213
-
214
-
215
-
216
-
217
-
218
-
219
-
220
-
221
-
222
-
223
-
224
-
225
-
226
-
227
-
228
-
229
-
230
-
231
-
232
-
233
-
234
-
235
-
236
-
237
-
238
-
239
-
240
-
241
-
242
-
243
-
244
-
245
-
246
-
247
-
248
-
249
-
250
 |
 |
F-65
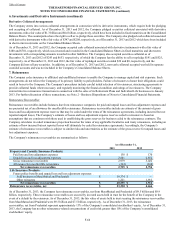
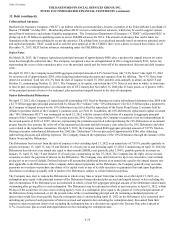
The allowance for uncollectible reinsurance reflects management’s best estimate of reinsurance cessions that may be uncollectible in the
future due to reinsurers’ unwillingness or inability to pay. The Company analyzes recent developments in commutation activity between
reinsurers and cedants, recent trends in arbitration and litigation outcomes in disputes between reinsurers and cedants and the overall
credit quality of the Company’s reinsurers. Based on this analysis, the Company may adjust the allowance for uncollectible reinsurance
or charge off reinsurer balances that are determined to be uncollectible. Where its contracts permit, the Company secures future claim
obligations with various forms of collateral, including irrevocable letters of credit, secured trusts, funds held accounts and group-wide
offsets.
Due to the inherent uncertainties as to collection and the length of time before reinsurance recoverables become due, it is possible that
future adjustments to the Company’s reinsurance recoverables, net of the allowance, could be required, which could have a material
adverse effect on the Company’s consolidated results of operations or cash flows in a particular quarter or annual period.
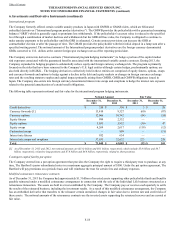
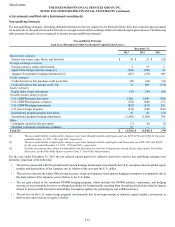
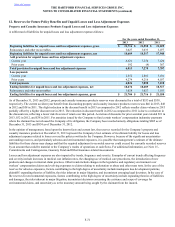
Insurance Revenues
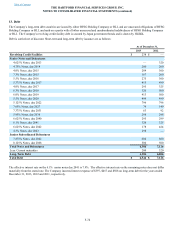
The effect of reinsurance on property and casualty premiums written and earned is as follows:
For the years ended December 31,
Premiums Written 2013 2012 2011
Direct $ 10,564 $ 10,405 $ 10,368
Assumed 247 230 226
Ceded (882)(788) (742)
Net $ 9,929 $ 9,847 $ 9,852
Premiums Earned
Direct $ 10,494 $ 10,484 $ 10,337
Assumed 241 205 225
Ceded (871)(796) (688)
Net $ 9,864 $ 9,893 $ 9,874
Ceded losses, which reduce losses and loss adjustment expenses incurred, were $459, $512, and $385 for the years ended December 31,
2013, 2012, and 2011, respectively.
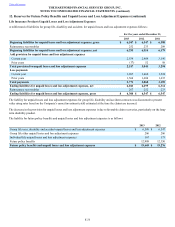
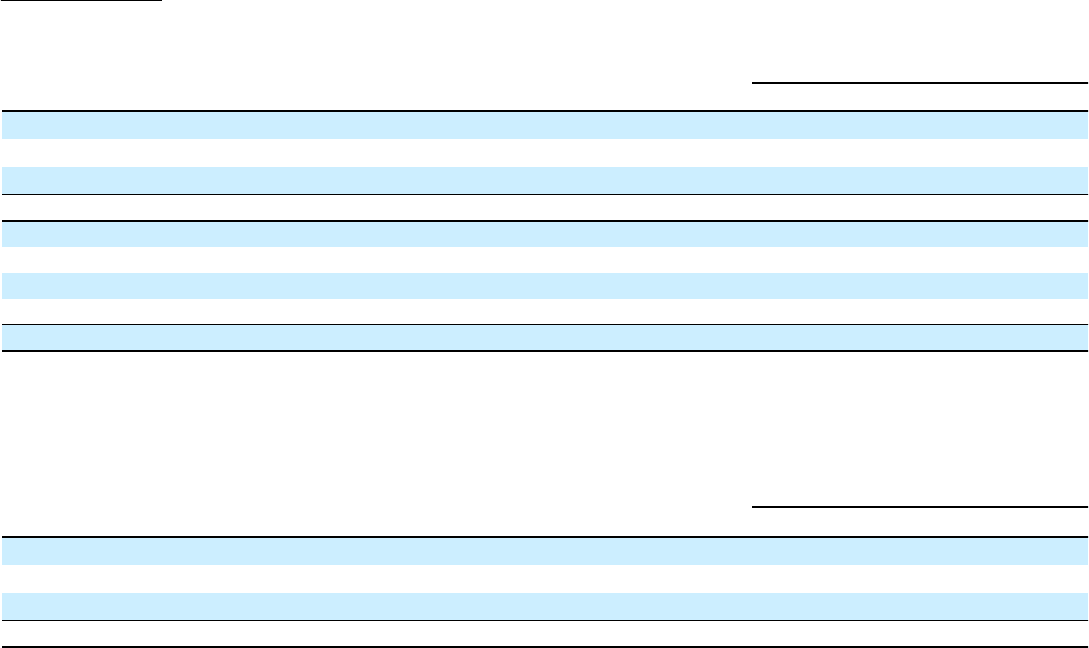
The effect of reinsurance on life insurance fees, earned premiums and other is as follows:
For the years ended December 31,
2013 2012 2011
Gross fee income, earned premiums and other $ 7,798 $ 8,500 $ 9,292
Reinsurance assumed 138 137 134
Reinsurance ceded (1,780)(524) (524)
Net fee income, earned premiums and other $ 6,156 $ 8,113 $ 8,902
The Company reinsures certain of its risks to other reinsurers under yearly renewable term, coinsurance, and modified coinsurance
arrangements, and variations thereto. Yearly renewable term and coinsurance arrangements result in passing all or a portion of the risk to
the reinsurer. Generally, the reinsurer receives a proportionate amount of the premiums less an allowance for commissions and expenses
and is liable for a corresponding proportionate amount of all benefit payments. Modified coinsurance is similar to coinsurance except
that the cash and investments that support the liabilities for contract benefits are not transferred to the assuming company, and
settlements are made on a net basis between the companies. Coinsurance with funds withheld is a form of coinsurance except that the
investment assets that support the liabilities are withheld by the ceding company.
The cost of reinsurance related to long-duration contracts is accounted for over the life of the underlying reinsured policies using assumptions
consistent with those used to account for the underlying policies. Insurance recoveries on ceded reinsurance agreements, which reduce
death and other benefits, were $913, $285 and $224 for the years ended December 31, 2013, 2012, and 2011, respectively.
In addition, the Company has reinsured a portion of the risk associated with U.S. variable annuities and the associated GMDB and
GMWB riders, and of the risks associated with variable annuity contract and rider benefits issued by Hartford Life Insurance KK
(“HLIKK”), an indirect wholly owned subsidiary.
Table of Contents THE HARTFORD FINANCIAL SERVICES GROUP, INC.
NOTES TO CONSOLIDATED FINANCIAL STATEMENTS (continued)
7. Reinsurance (continued)