The Hartford 2013 Annual Report Download - page 207
Download and view the complete annual report
Please find page 207 of the 2013 The Hartford annual report below. You can navigate through the pages in the report by either clicking on the pages listed below, or by using the keyword search tool below to find specific information within the annual report.-
 1
1 -
2
-
3
-
4
-
5
-
6
-
7
-
8
-
9
-
10
-
11
-
12
-
13
-
14
-
15
-
16
-
17
-
18
-
19
-
20
-
21
-
22
-
23
-
24
-
25
-
26
-
27
-
28
-
29
-
30
-
31
-
32
-
33
-
34
-
35
-
36
-
37
-
38
-
39
-
40
-
41
-
42
-
43
-
44
-
45
-
46
-
47
-
48
-
49
-
50
-
51
-
52
-
53
-
54
-
55
-
56
-
57
-
58
-
59
-
60
-
61
-
62
-
63
-
64
-
65
-
66
-
67
-
68
-
69
-
70
-
71
-
72
-
73
-
74
-
75
-
76
-
77
-
78
-
79
-
80
-
81
-
82
-
83
-
84
-
85
-
86
-
87
-
88
-
89
-
90
-
91
-
92
-
93
-
94
-
95
-
96
-
97
-
98
-
99
-
100
-
101
-
102
-
103
-
104
-
105
-
106
-
107
-
108
-
109
-
110
-
111
-
112
-
113
-
114
-
115
-
116
-
117
-
118
-
119
-
120
-
121
-
122
-
123
-
124
-
125
-
126
-
127
-
128
-
129
-
130
-
131
-
132
-
133
-
134
-
135
-
136
-
137
-
138
-
139
-
140
-
141
-
142
-
143
-
144
-
145
-
146
-
147
-
148
-
149
-
150
-
151
-
152
-
153
-
154
-
155
-
156
-
157
-
158
-
159
-
160
-
161
-
162
-
163
-
164
-
165
-
166
-
167
-
168
-
169
-
170
-
171
-
172
-
173
-
174
-
175
-
176
-
177
-
178
-
179
-
180
-
181
-
182
-
183
-
184
-
185
-
186
-
187
-
188
-
189
-
190
-
191
-
192
-
193
-
194
-
195
-
196
-
 197
197 -
 198
198 -
 199
199 -
 200
200 -
 201
201 -
 202
202 -
 203
203 -
 204
204 -
 205
205 -
 206
206 -
 207
207 -
 208
208 -
 209
209 -
 210
210 -
 211
211 -
 212
212 -
 213
213 -
 214
214 -
 215
215 -
 216
216 -
 217
217 -
218
-
219
-
220
-
221
-
222
-
223
-
224
-
225
-
226
-
227
-
228
-
229
-
230
-
231
-
232
-
233
-
234
-
235
-
236
-
237
-
238
-
239
-
240
-
241
-
242
-
243
-
244
-
245
-
246
-
247
-
248
-
249
-
250
 |
 |

F-71
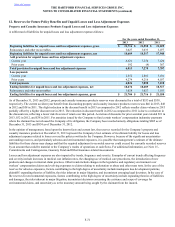
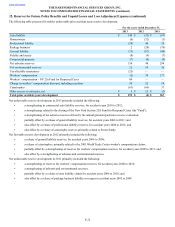
12. Reserves for Future Policy Benefits and Unpaid Losses and Loss Adjustment Expenses
Property and Casualty Insurance Products Unpaid Losses and Loss Adjustment Expenses
A rollforward of liabilities for unpaid losses and loss adjustment expenses follows:
For the years ended December 31,
2013 2012 2011
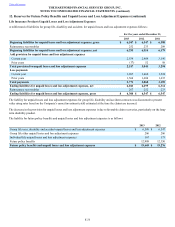
Beginning liabilities for unpaid losses and loss adjustment expenses, gross $ 21,716 $ 21,550 $ 21,025
Reinsurance and other recoverables 3,027 3,033 3,077
Beginning liabilities for unpaid losses and loss adjustment expenses, net 18,689 18,517 17,948
Add provision for unpaid losses and loss adjustment expenses
Current year 6,621 7,274 7,420
Prior years 192 (4) 367
Total provision for unpaid losses and loss adjustment expenses 6,813 7,270 7,787
Less payments
Current year 2,552 2,882 3,181
Prior years 4,274 4,216 4,037
Total payments 6,826 7,098 7,218
Ending liabilities for unpaid losses and loss adjustment expenses, net 18,676 18,689 18,517
Reinsurance and other recoverables 3,028 3,027 3,033
Ending liabilities for unpaid losses and loss adjustment expenses, gross $ 21,704 $ 21,716 $ 21,550
As of December 31, 2013 and 2012, property and casualty insurance products reserves were discounted by a total of $553 and $538,
respectively. The current accident year benefit from discounting property and casualty insurance products reserves was $46 in 2013, $48
in 2012 and $58 in 2011. The slight reduction in the discount benefit in 2013 as compared to 2012 reflects smaller claim volume in 2013
partially offset by a higher discount rate in 2013. The reduction in discount benefit in 2012 as compared to 2011 is due to a reduction in
the discount rate, reflecting a lower risk-free rate of return over this period. Accretion of discounts for prior accident years totaled $31 in
2013, $52 in 2012, and $38 in 2011. For annuities issued by the Company to fund certain workers’ compensation indemnity payments
where the claimant has not released the Company of its obligation, the Company has recorded annuity obligations totaling $805 as of
December 31, 2013 and $834 as of December 31, 2012.
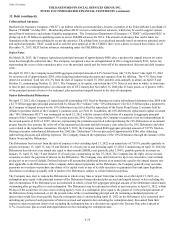
In the opinion of management, based upon the known facts and current law, the reserves recorded for the Company’s property and
casualty insurance products at December 31, 2013 represent the Company’s best estimate of its ultimate liability for losses and loss
adjustment expenses related to losses covered by policies written by the Company. However, because of the significant uncertainties
surrounding reserves, and particularly asbestos and environmental exposures, it is possible that management’s estimate of the ultimate
liabilities for these claims may change and that the required adjustment to recorded reserves could exceed the currently recorded reserves
by an amount that could be material to the Company’s results of operations or cash flows. For additional information, see Note 15 -
Commitments and Contingencies, Guaranty Fund and Other Insurance-related Assessments.
Losses and loss adjustment expenses are also impacted by trends, frequency and severity. Examples of current trends affecting frequency
and severity include increases in medical cost inflation rates, the changing use of medical care procedures, the introduction of new
products and changes in internal claim practices. Other trends include changes in the legislative and regulatory environment over
workers’ compensation claims and evolving exposures to claims relating to molestation or abuse and other mass torts. In the case of the
reserves for asbestos exposures, factors contributing to the high degree of uncertainty include inadequate loss development patterns,
plaintiffs’ expanding theories of liability, the risks inherent in major litigation, and inconsistent emerging legal doctrines. In the case of
the reserves for environmental exposures, factors contributing to the high degree of uncertainty include expanding theories of liabilities
and damages, the risks inherent in major litigation, inconsistent decisions concerning the existence and scope of coverage for
environmental claims, and uncertainty as to the monetary amount being sought by the claimant from the insured.
Table of Contents THE HARTFORD FINANCIAL SERVICES GROUP, INC.
NOTES TO CONSOLIDATED FINANCIAL STATEMENTS (continued)