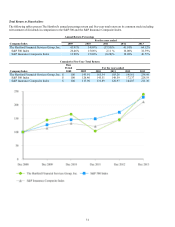
The Hartford 2013 Annual Report Download - page 35
Download and view the complete annual report
Please find page 35 of the 2013 The Hartford annual report below. You can navigate through the pages in the report by either clicking on the pages listed below, or by using the keyword search tool below to find specific information within the annual report.-
 1
1 -
2
-
3
-
4
-
5
-
6
-
7
-
8
-
9
-
10
-
11
-
12
-
13
-
14
-
15
-
16
-
17
-
18
-
19
-
20
-
21
-
22
-
23
-
24
-
 25
25 -
 26
26 -
 27
27 -
 28
28 -
 29
29 -
 30
30 -
 31
31 -
 32
32 -
 33
33 -
 34
34 -
 35
35 -
 36
36 -
 37
37 -
 38
38 -
 39
39 -
 40
40 -
 41
41 -
 42
42 -
 43
43 -
 44
44 -
 45
45 -
46
-
47
-
48
-
49
-
50
-
51
-
52
-
53
-
54
-
55
-
56
-
57
-
58
-
59
-
60
-
61
-
62
-
63
-
64
-
65
-
66
-
67
-
68
-
69
-
70
-
71
-
72
-
73
-
74
-
75
-
76
-
77
-
78
-
79
-
80
-
81
-
82
-
83
-
84
-
85
-
86
-
87
-
88
-
89
-
90
-
91
-
92
-
93
-
94
-
95
-
96
-
97
-
98
-
99
-
100
-
101
-
102
-
103
-
104
-
105
-
106
-
107
-
108
-
109
-
110
-
111
-
112
-
113
-
114
-
115
-
116
-
117
-
118
-
119
-
120
-
121
-
122
-
123
-
124
-
125
-
126
-
127
-
128
-
129
-
130
-
131
-
132
-
133
-
134
-
135
-
136
-
137
-
138
-
139
-
140
-
141
-
142
-
143
-
144
-
145
-
146
-
147
-
148
-
149
-
150
-
151
-
152
-
153
-
154
-
155
-
156
-
157
-
158
-
159
-
160
-
161
-
162
-
163
-
164
-
165
-
166
-
167
-
168
-
169
-
170
-
171
-
172
-
173
-
174
-
175
-
176
-
177
-
178
-
179
-
180
-
181
-
182
-
183
-
184
-
185
-
186
-
187
-
188
-
189
-
190
-
191
-
192
-
193
-
194
-
195
-
196
-
197
-
198
-
199
-
200
-
201
-
202
-
203
-
204
-
205
-
206
-
207
-
208
-
209
-
210
-
211
-
212
-
213
-
214
-
215
-
216
-
217
-
218
-
219
-
220
-
221
-
222
-
223
-
224
-
225
-
226
-
227
-
228
-
229
-
230
-
231
-
232
-
233
-
234
-
235
-
236
-
237
-
238
-
239
-
240
-
241
-
242
-
243
-
244
-
245
-
246
-
247
-
248
-
249
-
250
 |
 |

35
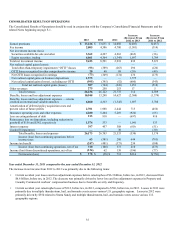
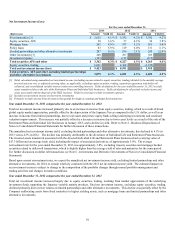
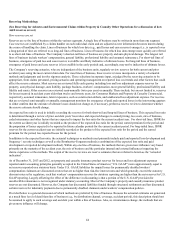
CONSOLIDATED RESULTS OF OPERATIONS
The Consolidated Results of Operations should be read in conjunction with the Company's Consolidated Financial Statements and the
related Notes beginning on page F-1.
2013 2012 2011
Increase
(Decrease) From
2012 to 2013
Increase
(Decrease) From
2011 to 2012
Earned premiums $ 13,226 $ 13,631 $ 14,088 $(405) $(457)
Fee income 2,805 4,386 4,700 (1,581) (314)
Net investment income (loss): — —
Securities available-for-sale and other 3,362 4,227 4,263 (865) (36)
Equity securities, trading 6,061 4,364 (1,345) 1,697 5,709
Total net investment income 9,423 8,591 2,918 832 5,673
Net realized capital gains (losses): — —
Total other-than-temporary impairment (“OTTI”) losses (93)(389) (263) 296 (126)
OTTI losses recognized in other comprehensive income 20 40 89 (20) (49)
Net OTTI losses recognized in earnings (73)(349) (174) 276 (175)
Net realized capital gains on business dispositions 1,575 — — 1,575 —
Net realized capital gains (losses), excluding net OTTI (995)(395) (52) (600) (343)
Total net realized capital gains (losses) 507 (744) (226) 1,251 (518)
Other revenues 275 258 253 17 5
Total revenues 26,236 26,122 21,733 114 4,389
Benefits, losses and loss adjustment expenses 10,948 13,248 14,627 (2,300) (1,379)
Benefits, losses and loss adjustment expenses — returns
credited on international variable annuities 6,060 4,363 (1,345) 1,697 5,708
Amortization of deferred policy acquisition costs and
present value of future profits 2,701 1,988 2,444 713 (456)
Insurance operating costs and other expenses 4,280 5,204 5,269 (924) (65)
Loss on extinguishment of debt 213 910 — (697) 910
Reinsurance loss on disposition, including reduction in
goodwill of $156 and $342, respectively 1,574 533 — 1,041 533
Interest expense 397 457 508 (60) (51)
Goodwill impairment —— 30 — (30)
Total benefits, losses and expenses 26,173 26,703 21,533 (530) 5,170
Income (loss) from continuing operations before
income taxes 63 (581) 200 644 (781)
Income tax benefit (247)(481) (373) 234 (108)
Income (loss) from continuing operations, net of tax 310 (100) 573 410 (673)
Income (loss) from discontinued operations, net of tax (134)62 139 (196) (77)
Net income (loss) $ 176 $ (38) $ 712 $214 $(750)
Year ended December 31, 2013 compared to the year ended December 31, 2012
The increase in net income from 2012 to 2013 was primarily due to the following items:
• Current accident year losses and loss adjustment expenses before catastrophes of $6.3 billion, before tax, in 2013, decreased from
$6.6 billion, before tax, in 2012. The decrease was primarily driven by lower loss and loss adjustment expenses in Property and
Casualty Commercial workers’ compensation business due to favorable severity and frequency.
• Current accident year catastrophe losses of $312, before tax, in 2013, compared to $706, before tax, in 2012. Losses in 2013 were
primarily due to multiple thunderstorm, hail, and tornado events across various U.S. geographic regions. Losses in 2012 were
primarily driven by $350 related to Storm Sandy and multiple thunderstorm, hail, and tornado events across various U.S.
geographic regions.