Symantec 2015 Annual Report Download - page 65
Download and view the complete annual report
Please find page 65 of the 2015 Symantec annual report below. You can navigate through the pages in the report by either clicking on the pages listed below, or by using the keyword search tool below to find specific information within the annual report.-
 1
1 -
2
-
3
-
4
-
5
-
6
-
7
-
8
-
9
-
10
-
11
-
12
-
13
-
14
-
15
-
16
-
17
-
18
-
19
-
20
-
21
-
22
-
23
-
24
-
25
-
26
-
27
-
28
-
29
-
30
-
31
-
32
-
33
-
34
-
35
-
36
-
37
-
38
-
39
-
40
-
41
-
42
-
43
-
44
-
45
-
46
-
47
-
48
-
49
-
50
-
51
-
52
-
53
-
54
-
 55
55 -
 56
56 -
 57
57 -
 58
58 -
 59
59 -
 60
60 -
 61
61 -
 62
62 -
 63
63 -
 64
64 -
 65
65 -
 66
66 -
 67
67 -
 68
68 -
 69
69 -
 70
70 -
 71
71 -
 72
72 -
 73
73 -
 74
74 -
 75
75 -
76
-
77
-
78
-
79
-
80
-
81
-
82
-
83
-
84
-
85
-
86
-
87
-
88
-
89
-
90
-
91
-
92
-
93
-
94
-
95
-
96
-
97
-
98
-
99
-
100
-
101
-
102
-
103
-
104
-
105
-
106
-
107
-
108
-
109
-
110
-
111
-
112
-
113
-
114
-
115
-
116
-
117
-
118
-
119
-
120
-
121
-
122
-
123
-
124
-
125
-
126
-
127
-
128
-
129
-
130
-
131
-
132
-
133
-
134
-
135
-
136
-
137
-
138
-
139
-
140
-
141
-
142
-
143
-
144
-
145
-
146
-
147
-
148
-
149
-
150
-
151
-
152
-
153
-
154
-
155
-
156
-
157
-
158
-
159
-
160
-
161
-
162
-
163
-
164
-
165
-
166
-
167
-
168
-
169
-
170
-
171
-
172
-
173
-
174
 |
 |

For a summary of the terms of the FY15 Executive Annual Incentive Plan, see “Compensation Discussion &
Analysis (CD&A) — Compensation Components — Executive Annual Incentive Plans” above. Details of acceleration
of the equity awards described are disclosed under “Compensation Discussion & Analysis (CD&A) — Other Benefits
— Change in Control and Severance Arrangements” above and “Potential Payments Upon Termination or Change in
Control” below.
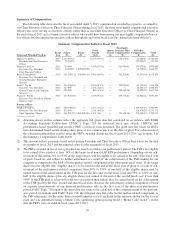
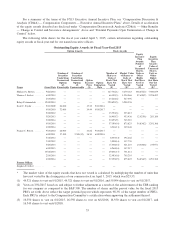
The following table shows for the fiscal year ended April 3, 2015, certain information regarding outstanding
equity awards at fiscal year end for our named executive officers.
Outstanding Equity Awards At Fiscal Year-End 2015
Option Awards Stock Awards
Name Grant Date
Number of
Securities
Underlying
Unexercised
Options
(#)
Exercisable
Number of
Securities
Underlying
Unexercised
Options
(#)
Unexercisable
Option
Exercise
Price
($)
Option
Expiration
Date
Number of
Shares or
Units of
Stock That
Have Not
Vested
(#)
Market Value
of Shares or
Units of
Stock That
Have Not
Vested
($)*
Equity
Incentive
Plan
Awards:
Number
of
Unearned
Shares,
Units or
Other
Rights
that Have
Not Yet
Vested
(#)
Equity
Incentive
Plan
Awards:
Value of
Unearned
Shares,
Units or
Other
Rights
that Have
Not Yet
Vested
($)*
Michael A. Brown ....... 9/24/2014 — — — — 147,736(1) 3,479,183 338,856(2) 7,980,059
Thomas J. Seifert ........ 6/10/2014 — — — — 66,199(3) 1,558,986 97,609(2) 2,298,692
6/10/2014 — — — — 23,244(4) 547,396 — —
Balaji Yelamanchili ...... 12/10/2014 — — — — 220,822(5) 5,200,358
Scott C. Taylor .......... 5/11/2009 26,000 — 15.32 5/11/2016 — — — —
6/10/2010 72,000 — 14.44 6/10/2017 — — — —
5/10/2012 — — — — 13,750(6) 323,813 — —
5/20/2013 — — — — 18,405(7) 433,438 12,025(8) 283,189
2/10/2014 — — — — 32,493(9) 765,210
6/10/2014 — — — — 37,190(10) 875,825 54,836(2) 1,291,388
6/10/2014 — — — — 6,346(11) 149,448 —
Francis C. Rosch......... 9/10/2010 28,000 — 14.86 9/10/2017 — — — —
6/10/2011 37,500 2,500(12) 18.50 6/10/2018 — — — —
5/10/2012 — — — — 8,333(13) 196,242 — —
7/10/2012 — — — — 5,000(14) 117,750 —
5/20/2013 — — — — 15,338(15) 361,210 10,020(8) 235,971
6/10/2013 — — — — 6,264(16) 147,517 — —
10/10/2013 — — — — 29,801(17) 701,814 — —
2/10/2014 — — — — 32,493(18) 765,210 — —
6/10/2014 — — — — 37,190(19) 875,825 54,836(2) 1,291,388
Former Officer:
Stephen E. Gillett ........ — — — — — — — — —
* The market value of the equity awards that have not vested is calculated by multiplying the number of units that
have not vested by the closing price of our common stock on April 3, 2015, which was $23.55.
(1) 44,321 shares to vest on 9/1/2015, 44,321 shares to vest on 9/1/2016, and 59,094 shares to vest on 9/1/2017.
(2) Vests on 3/31/2017 based on, and subject to further adjustment as a result of, the achievement of the TSR ranking
for our company as compared to the S&P 500. The number of shares and the payout value for the fiscal 2015
PRUs set forth above reflect the target potential payout which represents 98.3% of the target number of PRUs.
Each PRU is subject to the Compensation Committee’s certification when approving the settlement thereof.
(3) 16,550 shares to vest on 6/1/2015, 16,550 shares to vest on 6/1/2016, 16,550 shares to vest on 6/1/2017, and
16,549 shares to vest on 6/1/2018.
55