Symantec 2015 Annual Report Download - page 138
Download and view the complete annual report
Please find page 138 of the 2015 Symantec annual report below. You can navigate through the pages in the report by either clicking on the pages listed below, or by using the keyword search tool below to find specific information within the annual report.-
 1
1 -
2
-
3
-
4
-
5
-
6
-
7
-
8
-
9
-
10
-
11
-
12
-
13
-
14
-
15
-
16
-
17
-
18
-
19
-
20
-
21
-
22
-
23
-
24
-
25
-
26
-
27
-
28
-
29
-
30
-
31
-
32
-
33
-
34
-
35
-
36
-
37
-
38
-
39
-
40
-
41
-
42
-
43
-
44
-
45
-
46
-
47
-
48
-
49
-
50
-
51
-
52
-
53
-
54
-
55
-
56
-
57
-
58
-
59
-
60
-
61
-
62
-
63
-
64
-
65
-
66
-
67
-
68
-
69
-
70
-
71
-
72
-
73
-
74
-
75
-
76
-
77
-
78
-
79
-
80
-
81
-
82
-
83
-
84
-
85
-
86
-
87
-
88
-
89
-
90
-
91
-
92
-
93
-
94
-
95
-
96
-
97
-
98
-
99
-
100
-
101
-
102
-
103
-
104
-
105
-
106
-
107
-
108
-
109
-
110
-
111
-
112
-
113
-
114
-
115
-
116
-
117
-
118
-
119
-
120
-
121
-
122
-
123
-
124
-
125
-
126
-
127
-
 128
128 -
 129
129 -
 130
130 -
 131
131 -
 132
132 -
 133
133 -
 134
134 -
 135
135 -
 136
136 -
 137
137 -
 138
138 -
 139
139 -
 140
140 -
 141
141 -
 142
142 -
 143
143 -
 144
144 -
 145
145 -
 146
146 -
 147
147 -
 148
148 -
149
-
150
-
151
-
152
-
153
-
154
-
155
-
156
-
157
-
158
-
159
-
160
-
161
-
162
-
163
-
164
-
165
-
166
-
167
-
168
-
169
-
170
-
171
-
172
-
173
-
174
 |
 |

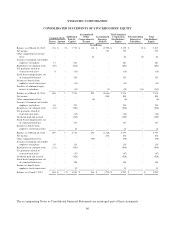
SYMANTEC CORPORATION
CONSOLIDATED STATEMENTS OF STOCKHOLDERS’ EQUITY
Common Stock Additional
Paid-In
Capital
Accumulated
Other
Comprehensive
Income
Accumulated
Earnings
(Deficit)
Total Symantec
Corporation
Stockholders’
Equity
Noncontrolling
Interest in
Subsidiary
Total
Stockholders’
EquityShares Amount
(In millions)
Balance as of March 30, 2012 724 $ 7 $ 7,773 $ 178 $ (2,799) $ 5,159 $ 78 $ 5,237
Net income - - - - 755 755 - 755
Other comprehensive income
(loss) - - - 24 - 24 (2) 22
Issuance of common stock under
employee stock plans 17 - 281 - - 281 - 281
Repurchases of common stock (49) - (826) - - (826) - (826)
Tax payments related to
restricted stock units 6 - (36) - - (36) - (36)
Stock-based compensation, net
of estimated forfeitures - - 165 - - 165 - 165
Income tax benefit from
employee stock transactions - - (11) - - (11) - (11)
Purchase of additional equity
interest in subsidiary - - (33) - (2) (35) (76) (111)
Balance as of March 29, 2013 698 7 7,313 202 (2,046) 5,476 - 5,476
Net income - - - - 898 898 - 898
Other comprehensive loss - - - (8) - (8) (8)
Issuance of common stock under
employee stock plans 18 - 234 - - 234 - 234
Repurchases of common stock (21) - (500) - - (500) - (500)
Tax payments related to
restricted stock units - - (45) - - (45) - (45)
Dividends paid and accrued - - (429) - - (429) - (429)
Stock-based compensation, net
of estimated forfeitures - - 157 - - 157 - 157
Income tax benefit from
employee stock transactions - - 14 - - 14 - 14
Balance as of March 28, 2014 695 7 6,744 194 (1,148) 5,797 - 5,797
Net income - - - - 878 878 - 878
Other comprehensive loss - - - (90) - (90) - (90)
Issuance of common stock under
employee stock plans 10 - 116 - - 116 - 116
Repurchases of common stock (21) - (500) - - (500) - (500)
Tax payments related to
restricted stock units - - (47) - - (47) - (47)
Dividends paid and accrued - - (428) - - (428) - (428)
Stock-based compensation, net
of estimated forfeitures - - 198 - - 198 - 198
Income tax benefit from
employee stock transactions - - 11 - - 11 - 11
Balance as of April 3, 2015 684 $ 7 $ 6,094 $ 104 $ (270) $ 5,935 $ - $ 5,935
The accompanying Notes to Consolidated Financial Statements are an integral part of these statements.
60