Symantec 2015 Annual Report Download - page 126
Download and view the complete annual report
Please find page 126 of the 2015 Symantec annual report below. You can navigate through the pages in the report by either clicking on the pages listed below, or by using the keyword search tool below to find specific information within the annual report.-
 1
1 -
2
-
3
-
4
-
5
-
6
-
7
-
8
-
9
-
10
-
11
-
12
-
13
-
14
-
15
-
16
-
17
-
18
-
19
-
20
-
21
-
22
-
23
-
24
-
25
-
26
-
27
-
28
-
29
-
30
-
31
-
32
-
33
-
34
-
35
-
36
-
37
-
38
-
39
-
40
-
41
-
42
-
43
-
44
-
45
-
46
-
47
-
48
-
49
-
50
-
51
-
52
-
53
-
54
-
55
-
56
-
57
-
58
-
59
-
60
-
61
-
62
-
63
-
64
-
65
-
66
-
67
-
68
-
69
-
70
-
71
-
72
-
73
-
74
-
75
-
76
-
77
-
78
-
79
-
80
-
81
-
82
-
83
-
84
-
85
-
86
-
87
-
88
-
89
-
90
-
91
-
92
-
93
-
94
-
95
-
96
-
97
-
98
-
99
-
100
-
101
-
102
-
103
-
104
-
105
-
106
-
107
-
108
-
109
-
110
-
111
-
112
-
113
-
114
-
115
-
 116
116 -
 117
117 -
 118
118 -
 119
119 -
 120
120 -
 121
121 -
 122
122 -
 123
123 -
 124
124 -
 125
125 -
 126
126 -
 127
127 -
 128
128 -
 129
129 -
 130
130 -
 131
131 -
 132
132 -
 133
133 -
 134
134 -
 135
135 -
 136
136 -
137
-
138
-
139
-
140
-
141
-
142
-
143
-
144
-
145
-
146
-
147
-
148
-
149
-
150
-
151
-
152
-
153
-
154
-
155
-
156
-
157
-
158
-
159
-
160
-
161
-
162
-
163
-
164
-
165
-
166
-
167
-
168
-
169
-
170
-
171
-
172
-
173
-
174
 |
 |

order to separate the business, we initiated a restructuring plan to properly align personnel and expect to incur
associated severance and facilities costs. We also expect to incur separation costs in the form of advisory,
consulting and disentanglement expenses. These actions are expected to be completed in fiscal 2016. We expect
to incur total severance and facilities costs between $165 million and $195 million. We expect to incur separation
costs between $170 million and $190 million, excluding any potential tax implications outside the U.S. and
potential advisor fees payable upon separation. Total restructuring and separation costs are expected to be
between $335 million and $385 million. As of April 3, 2015, liabilities for excess facility obligations at several
locations around the world are expected to be paid throughout the respective lease terms as we continue to
occupy these facilities, the longest of which extends through fiscal 2019.
In fiscal 2013, we initiated a restructuring plan to reduce management and redundant personnel resulting in
headcount reductions across the Company. As of April 3, 2015, the related costs for severance and benefits are
substantially complete; however, we expect to incur immaterial adjustments to existing reserves in subsequent
periods.
Note Repayments. In fiscal 2014, the principal balance of our 1.00% Convertible Senior Notes issued in
fiscal 2007 matured and was settled by a cash payment of $1.0 billion, along with the $5 million semiannual
interest payment. In addition, we elected to pay the conversion value above par value in cash in the amount of
$189 million. Concurrently with the payment of the conversion value, we received $189 million from the note
hedge we entered into at the time of issuance of the 1.00% notes. In fiscal 2016, $350 million of principal
amount of 2.75% Senior Notes due September 2015 will mature and become due and payable.
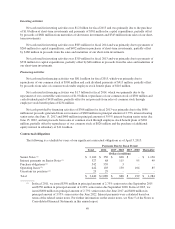
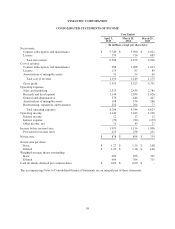
Cash Flows
The following table summarizes, for the fiscal periods indicated, selected items in our Consolidated
Statements of Cash Flows:
2015 2014 2013
(Dollars in millions)
Net cash provided by (used in):
Operating activities $ 1,312 $ 1,281 $ 1,593
Investing activities (1,154) (583) (319)
Financing activities (811) (1,712) 308
Operating activities
We expect cash from our operating activities to fluctuate in future periods as a result of a number of factors,
including the timing of our billings and collections, our operating results, the timing and amount of tax and other
liability payments.
Net cash provided by operating activities was $1.3 billion for fiscal 2015, which resulted from net income of
$878 million adjusted for non-cash items, including depreciation and amortization charges of $443 million and
stock-based compensation expense of $195 million. These amounts were partially offset by decreases in income
taxes payable of $191 million and accounts payable of $65 million.
Net cash provided by operating activities was $1.3 billion for fiscal 2014, which resulted from net income of
$898 million adjusted for non-cash items, including depreciation and amortization charges of $498 million and
stock-based compensation expense of $156 million. These amounts were partially offset by decreases in deferred
revenue of $223 million.
Net cash provided by operating activities was $1.6 billion for fiscal 2013, which resulted from net income of
$755 million adjusted for non-cash items, including depreciation and amortization charges of $698 million and
stock-based compensation expense of $164 million, and an increase in deferred revenue of $119 million. These
amounts were partially offset by an increase in trade accounts receivable, net of $107 million.
48