Symantec 2015 Annual Report Download - page 121
Download and view the complete annual report
Please find page 121 of the 2015 Symantec annual report below. You can navigate through the pages in the report by either clicking on the pages listed below, or by using the keyword search tool below to find specific information within the annual report.-
 1
1 -
2
-
3
-
4
-
5
-
6
-
7
-
8
-
9
-
10
-
11
-
12
-
13
-
14
-
15
-
16
-
17
-
18
-
19
-
20
-
21
-
22
-
23
-
24
-
25
-
26
-
27
-
28
-
29
-
30
-
31
-
32
-
33
-
34
-
35
-
36
-
37
-
38
-
39
-
40
-
41
-
42
-
43
-
44
-
45
-
46
-
47
-
48
-
49
-
50
-
51
-
52
-
53
-
54
-
55
-
56
-
57
-
58
-
59
-
60
-
61
-
62
-
63
-
64
-
65
-
66
-
67
-
68
-
69
-
70
-
71
-
72
-
73
-
74
-
75
-
76
-
77
-
78
-
79
-
80
-
81
-
82
-
83
-
84
-
85
-
86
-
87
-
88
-
89
-
90
-
91
-
92
-
93
-
94
-
95
-
96
-
97
-
98
-
99
-
100
-
101
-
102
-
103
-
104
-
105
-
106
-
107
-
108
-
109
-
110
-
 111
111 -
 112
112 -
 113
113 -
 114
114 -
 115
115 -
 116
116 -
 117
117 -
 118
118 -
 119
119 -
 120
120 -
 121
121 -
 122
122 -
 123
123 -
 124
124 -
 125
125 -
 126
126 -
 127
127 -
 128
128 -
 129
129 -
 130
130 -
 131
131 -
132
-
133
-
134
-
135
-
136
-
137
-
138
-
139
-
140
-
141
-
142
-
143
-
144
-
145
-
146
-
147
-
148
-
149
-
150
-
151
-
152
-
153
-
154
-
155
-
156
-
157
-
158
-
159
-
160
-
161
-
162
-
163
-
164
-
165
-
166
-
167
-
168
-
169
-
170
-
171
-
172
-
173
-
174
 |
 |

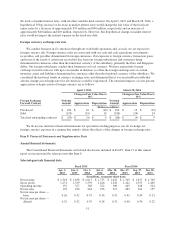
Fluctuations in the U.S. dollar compared to foreign currencies unfavorably impacted our international
revenue by approximately $156 million for fiscal 2015 as compared to fiscal 2014. Fiscal 2015 revenue for the
EMEA and Asia Pacific and Japan regions decreased primarily due to unfavorable foreign currency fluctuations
of $100 million and $54 million, respectively, compared to fiscal 2014.
Fluctuations in the U.S. dollar compared to foreign currencies unfavorably impacted our international
revenue by approximately $20 million for fiscal 2014 as compared to fiscal 2013. This was due to a $90 million
unfavorable foreign currency fluctuation in the Asia Pacific and Japan region partially offset by a favorable
foreign currency fluctuation of $70 million in the EMEA region.
Our international sales are expected to continue to be a significant portion of our revenue. As a result,
revenue is expected to continue to be affected by foreign currency exchange rates as compared to the U.S. dollar.
We are unable to predict the extent to which revenue in future periods will be impacted by changes in foreign
currency exchange rates. If international sales become a greater portion of our total sales in the future, changes in
foreign currency exchange rates may have a potentially greater impact on our revenue and operating results.
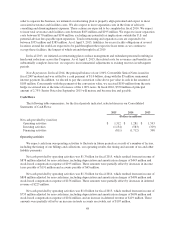
Cost of revenue by fiscal year
Change in %
2015 2014 2013 2015 v 2014 2014 v 2013
(Dollars in millions)
Cost of content, subscription, and maintenance $ 988 $ 1,008 $ 1,017 (2)% (1)%
Cost of license 114 87 89 31% (2)%
Amortization of intangible assets 51 54 69 (6)% (22)%
Total $ 1,153 $ 1,149 $ 1,175 -% (2)%
2015 compared to 2014:
Cost of content, subscription, and maintenance consists primarily of technical support costs, costs of billable
services, and fees to OEMs under revenue-sharing agreements. Cost of license consists primarily of royalties paid to
third parties under technology licensing agreements, appliance manufacturing costs, and other direct material costs.
Intangible assets are primarily comprised of developed technologies and patents from acquired companies. Our total
cost of revenue remained relatively consistent for fiscal 2015 compared to fiscal 2014. Cost of license increased in
fiscal 2015 compared to fiscal 2014, primarily due to direct costs associated with our appliance offerings.
2014 compared to 2013:
Our total cost of revenue remained relatively consistent for fiscal 2014 compared to fiscal 2013.
Amortization of intangible assets decreased in fiscal 2014 compared to fiscal 2013 as certain developed
technologies from acquired companies became fully amortized early in fiscal 2014.
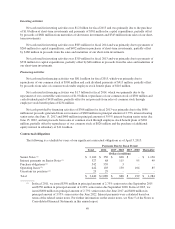
Operating expenses by fiscal year
Change in %
2015 2014 2013 2015 v 2014 2014 v 2013
(Dollars in millions)
Sales and marketing expense $ 2,323 $ 2,439 $ 2,789 (5)% (13)%
Research and development expense 1,144 1,039 1,026 10% 1%
General and administrative expense 379 446 447 (15)% -%
Amortization of intangible assets 108 156 286 (31)% (45)%
Restructuring, separation, and transition 252 264 77 (5)% 243%
Total $ 4,206 $ 4,344 $ 4,625 (3)% (6)%
43