Symantec 2015 Annual Report Download - page 136
Download and view the complete annual report
Please find page 136 of the 2015 Symantec annual report below. You can navigate through the pages in the report by either clicking on the pages listed below, or by using the keyword search tool below to find specific information within the annual report.-
 1
1 -
2
-
3
-
4
-
5
-
6
-
7
-
8
-
9
-
10
-
11
-
12
-
13
-
14
-
15
-
16
-
17
-
18
-
19
-
20
-
21
-
22
-
23
-
24
-
25
-
26
-
27
-
28
-
29
-
30
-
31
-
32
-
33
-
34
-
35
-
36
-
37
-
38
-
39
-
40
-
41
-
42
-
43
-
44
-
45
-
46
-
47
-
48
-
49
-
50
-
51
-
52
-
53
-
54
-
55
-
56
-
57
-
58
-
59
-
60
-
61
-
62
-
63
-
64
-
65
-
66
-
67
-
68
-
69
-
70
-
71
-
72
-
73
-
74
-
75
-
76
-
77
-
78
-
79
-
80
-
81
-
82
-
83
-
84
-
85
-
86
-
87
-
88
-
89
-
90
-
91
-
92
-
93
-
94
-
95
-
96
-
97
-
98
-
99
-
100
-
101
-
102
-
103
-
104
-
105
-
106
-
107
-
108
-
109
-
110
-
111
-
112
-
113
-
114
-
115
-
116
-
117
-
118
-
119
-
120
-
121
-
122
-
123
-
124
-
125
-
 126
126 -
 127
127 -
 128
128 -
 129
129 -
 130
130 -
 131
131 -
 132
132 -
 133
133 -
 134
134 -
 135
135 -
 136
136 -
 137
137 -
 138
138 -
 139
139 -
 140
140 -
 141
141 -
 142
142 -
 143
143 -
 144
144 -
 145
145 -
 146
146 -
147
-
148
-
149
-
150
-
151
-
152
-
153
-
154
-
155
-
156
-
157
-
158
-
159
-
160
-
161
-
162
-
163
-
164
-
165
-
166
-
167
-
168
-
169
-
170
-
171
-
172
-
173
-
174
 |
 |

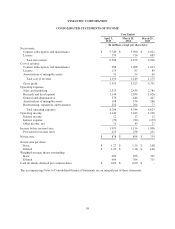
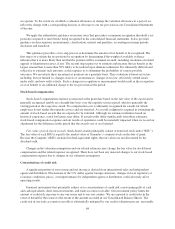
SYMANTEC CORPORATION
CONSOLIDATED STATEMENTS OF INCOME
Year Ended
April 3,
2015
March 28,
2014
March 29,
2013
(In millions, except per share data)
Net revenue:
Content, subscription, and maintenance $ 5,749 $ 5,960 $ 6,021
License 759 716 885
Total net revenue 6,508 6,676 6,906
Cost of revenue:
Content, subscription, and maintenance 988 1,008 1,017
License 114 87 89
Amortization of intangible assets 51 54 69
Total cost of revenue 1,153 1,149 1,175
Gross profit 5,355 5,527 5,731
Operating expenses:
Sales and marketing 2,323 2,439 2,789
Research and development 1,144 1,039 1,026
General and administrative 379 446 447
Amortization of intangible assets 108 156 286
Restructuring, separation, and transition 252 264 77
Total operating expenses 4,206 4,344 4,625
Operating income 1,149 1,183 1,106
Interest income 12 12 12
Interest expense (79) (84) (139)
Other income, net 11 45 27
Income before income taxes 1,093 1,156 1,006
Provision for income taxes 215 258 251
Net income $ 878 $ 898 $ 755
Net income per share:
Basic $ 1.27 $ 1.29 $ 1.08
Diluted $ 1.26 $ 1.28 $ 1.06
Weighted-average shares outstanding:
Basic 689 696 701
Diluted 696 704 711
Cash dividends declared per common share $ 0.60 $ 0.60 $ -
The accompanying Notes to Consolidated Financial Statements are an integral part of these statements.
58