Symantec 2015 Annual Report Download - page 161
Download and view the complete annual report
Please find page 161 of the 2015 Symantec annual report below. You can navigate through the pages in the report by either clicking on the pages listed below, or by using the keyword search tool below to find specific information within the annual report.-
 1
1 -
2
-
3
-
4
-
5
-
6
-
7
-
8
-
9
-
10
-
11
-
12
-
13
-
14
-
15
-
16
-
17
-
18
-
19
-
20
-
21
-
22
-
23
-
24
-
25
-
26
-
27
-
28
-
29
-
30
-
31
-
32
-
33
-
34
-
35
-
36
-
37
-
38
-
39
-
40
-
41
-
42
-
43
-
44
-
45
-
46
-
47
-
48
-
49
-
50
-
51
-
52
-
53
-
54
-
55
-
56
-
57
-
58
-
59
-
60
-
61
-
62
-
63
-
64
-
65
-
66
-
67
-
68
-
69
-
70
-
71
-
72
-
73
-
74
-
75
-
76
-
77
-
78
-
79
-
80
-
81
-
82
-
83
-
84
-
85
-
86
-
87
-
88
-
89
-
90
-
91
-
92
-
93
-
94
-
95
-
96
-
97
-
98
-
99
-
100
-
101
-
102
-
103
-
104
-
105
-
106
-
107
-
108
-
109
-
110
-
111
-
112
-
113
-
114
-
115
-
116
-
117
-
118
-
119
-
120
-
121
-
122
-
123
-
124
-
125
-
126
-
127
-
128
-
129
-
130
-
131
-
132
-
133
-
134
-
135
-
136
-
137
-
138
-
139
-
140
-
141
-
142
-
143
-
144
-
145
-
146
-
147
-
148
-
149
-
150
-
 151
151 -
 152
152 -
 153
153 -
 154
154 -
 155
155 -
 156
156 -
 157
157 -
 158
158 -
 159
159 -
 160
160 -
 161
161 -
 162
162 -
 163
163 -
 164
164 -
 165
165 -
 166
166 -
 167
167 -
 168
168 -
 169
169 -
 170
170 -
 171
171 -
172
-
173
-
174
 |
 |

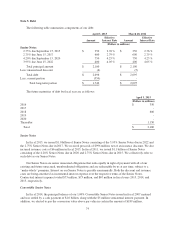
Restricted stock units
Number of
Shares
Weighted-
Average
Grant Date Fair
Value
Weighted-
Average
Remaining
Years
Aggregate Intrinsic
Value
(In millions, except per share and years data)
Outstanding at March 28, 2014 19 $ 20.61
Granted 18 22.66
Vested and released (6) 19.27
Forfeited (5) 21.06
Outstanding and unvested at April 3, 2015 26 $ 22.23 1.4 $ 622
Expected to vest at April 3, 2015 22 1.3 $ 508
The weighted-average grant date fair value per share of restricted stock granted during fiscal 2015, 2014,
and 2013, including assumed restricted stock was $22.66, $23.90, and $15.74, respectively. The total fair value
of restricted stock that vested and released in fiscal 2015, 2014, and 2013 was $133 million, $147 million, and
$124 million, respectively.
As of April 3, 2015, total unrecognized compensation cost adjusted for estimated forfeitures related
restricted stock was $368 million, which is expected to be recognized over the remaining weighted-average
vesting period of 2.5 years.
Performance-based restricted stock units
During fiscal 2015, 2014 and 2013, we granted performance-based restricted stock units (“PRUs”) to certain
senior level employees under our 2013 Plan and 2004 Plan. During fiscal 2015, we granted 2 million PRUs. As
of April 3, 2015 and March 28, 2014, there were 2 million and 1 million PRUs unvested, respectively. The
weighted-average grant date fair value per share of PRUs granted during fiscal 2015, 2014, and 2013 was $26.30,
$26.03 and $16.97, respectively.
During each of fiscal 2015, 2014 and 2013, we recognized $13 million of compensation cost related to
PRUs and performance-contingent stock units (“PCSUs”). As of April 3, 2015, total unrecognized compensation
cost related to the PRUs was approximately $18 million, which is expected to be recognized over the remaining
weighted-average period of 1.8 years. No PCSUs were granted during fiscal 2015 and none remained unvested as
of April 3, 2015.
Shares reserved
We reserved the following shares of authorized but unissued common stock:
April 3, 2015
(In millions)
Stock purchase plans 45
Stock award plans 53
Total 98
83