Symantec 2015 Annual Report Download - page 55
Download and view the complete annual report
Please find page 55 of the 2015 Symantec annual report below. You can navigate through the pages in the report by either clicking on the pages listed below, or by using the keyword search tool below to find specific information within the annual report.-
 1
1 -
2
-
3
-
4
-
5
-
6
-
7
-
8
-
9
-
10
-
11
-
12
-
13
-
14
-
15
-
16
-
17
-
18
-
19
-
20
-
21
-
22
-
23
-
24
-
25
-
26
-
27
-
28
-
29
-
30
-
31
-
32
-
33
-
34
-
35
-
36
-
37
-
38
-
39
-
40
-
41
-
42
-
43
-
44
-
 45
45 -
 46
46 -
 47
47 -
 48
48 -
 49
49 -
 50
50 -
 51
51 -
 52
52 -
 53
53 -
 54
54 -
 55
55 -
 56
56 -
 57
57 -
 58
58 -
 59
59 -
 60
60 -
 61
61 -
 62
62 -
 63
63 -
 64
64 -
 65
65 -
66
-
67
-
68
-
69
-
70
-
71
-
72
-
73
-
74
-
75
-
76
-
77
-
78
-
79
-
80
-
81
-
82
-
83
-
84
-
85
-
86
-
87
-
88
-
89
-
90
-
91
-
92
-
93
-
94
-
95
-
96
-
97
-
98
-
99
-
100
-
101
-
102
-
103
-
104
-
105
-
106
-
107
-
108
-
109
-
110
-
111
-
112
-
113
-
114
-
115
-
116
-
117
-
118
-
119
-
120
-
121
-
122
-
123
-
124
-
125
-
126
-
127
-
128
-
129
-
130
-
131
-
132
-
133
-
134
-
135
-
136
-
137
-
138
-
139
-
140
-
141
-
142
-
143
-
144
-
145
-
146
-
147
-
148
-
149
-
150
-
151
-
152
-
153
-
154
-
155
-
156
-
157
-
158
-
159
-
160
-
161
-
162
-
163
-
164
-
165
-
166
-
167
-
168
-
169
-
170
-
171
-
172
-
173
-
174
 |
 |

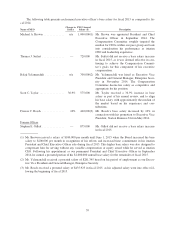
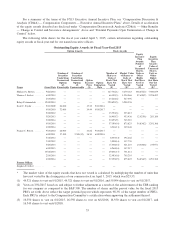
The following table summarizes the number of shares granted in fiscal 2015, value of each award and the
total value of the equity awards for each named executive officer as of the Grant Date (all values of restricted
stock unit awards are based upon the closing price for a share of our common stock of $21.29 on June 10, 2014,
except Mr. Brown’s RSU grant was made on September 24, 2014 with a closing price of $24.15 per share and
Mr. Yelamanchili’s RSU grant was made on December 10, 2014 with a closing price of $25.51 per share).
Name of NEO
Target
PRUs
(#)
PRU Value
at Grant
Date ($) RSUs (#)
Retention-
Based
RSUs (#)
RSU Value
at Grant
Date ($)
Total Target
Equity Incentive
Awards
Value at
Grant Date($)
Michael A. Brown .................. 344,717 10,609,355 147,736 n/a 3,567,824 14,177,180
Thomas J. Seifert ................... 99,298 2,490,592 89,443 n/a 1,904,241 4,394,834
Balaji Yelamanchili* ................ — — 276,028 n/a 7,042,854 7,042,854
Scott C. Taylor .................... 55,785 1,399,199 37,190 6,346 926,881 2,326,081
Francis C. Rosch ................... 55,785 1,399,199 37,190 n/a 791,775 2,190,974
Former Officer
Stephen E. Gillett .................. 97,624 2,448,605 65,083 25,423 1,926,873 4,375,478
* Mr. Yelamanchili did not receive a PRU grant due to his start date.
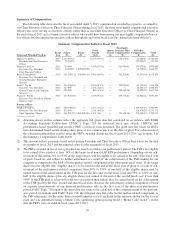
Burn Rate and Dilution: We closely manage how we use our equity to compensate employees. We think
of “gross burn rate” as the total number of shares granted under all of our equity incentive plans during a period
divided by the weighted average number of shares of common stock outstanding during that period and
expressed as a percentage. We think of “net burn rate” as the total number of shares granted under all of our
equity incentive plans during a period, minus the total number of shares returned to such plans through awards
cancelled during that period, divided by the weighted average number of shares of common stock outstanding
during that period, and expressed as a percentage. “Overhang” we think of as the total number of shares under-
lying options and awards outstanding plus shares available for issuance under all of our equity incentive plans at
the end of a period divided by the weighted average number of shares of common stock outstanding during that
period and expressed as a percentage. The Compensation Committee determines the percentage of equity to be
made available for our equity programs with reference to the companies in our market composite. In addition, the
Compensation Committee considers the accounting costs that will be reflected in our financial statements when
establishing the forms of equity to be granted and the size of the overall pool available. For fiscal 2015, our gross
burn rate was 2.79%, our net burn rate was 1.76%, and our overhang was 14.23%.
Equity Grant Practices: The Compensation Committee generally approves grants to the named executive
officers at its first meeting of each fiscal year, or shortly thereafter through subsequent action. The grant date for
all equity grants made to employees, including the named executive officers, is generally the 10th day of the
month following the applicable meeting. If the 10th day is not a business day, the grant is generally made on the
previous business day. The Compensation Committee does not coordinate the timing of equity awards with the
release of material, nonpublic information. RSUs may be granted from time to time throughout the year, but all
RSUs generally vest on either March 1, June 1, September 1 or December 1 for administrative reasons. PRUs are
currently granted once a year and, subject to certain exceptions, vesting occurs only after a three-year perform-
ance period.
Change of Control and Severance Arrangements: The vesting of certain stock options, RSUs and PRUs
held by our named executive officers will accelerate if they experience an involuntary (including constructive)
termination of employment under certain circumstances. For additional information about these arrangements,
see “— Other Benefits — Change of Control and Severance Arrangements” below and “Potential Payments
Upon Termination or Change in Control,” below.
Other Awards
Certain business conditions may warrant using additional compensation approaches to attract, retain or
motivate executives. Such conditions include acquisitions and divestitures, attracting or retaining specific or
45