Symantec 2015 Annual Report Download - page 149
Download and view the complete annual report
Please find page 149 of the 2015 Symantec annual report below. You can navigate through the pages in the report by either clicking on the pages listed below, or by using the keyword search tool below to find specific information within the annual report.-
 1
1 -
2
-
3
-
4
-
5
-
6
-
7
-
8
-
9
-
10
-
11
-
12
-
13
-
14
-
15
-
16
-
17
-
18
-
19
-
20
-
21
-
22
-
23
-
24
-
25
-
26
-
27
-
28
-
29
-
30
-
31
-
32
-
33
-
34
-
35
-
36
-
37
-
38
-
39
-
40
-
41
-
42
-
43
-
44
-
45
-
46
-
47
-
48
-
49
-
50
-
51
-
52
-
53
-
54
-
55
-
56
-
57
-
58
-
59
-
60
-
61
-
62
-
63
-
64
-
65
-
66
-
67
-
68
-
69
-
70
-
71
-
72
-
73
-
74
-
75
-
76
-
77
-
78
-
79
-
80
-
81
-
82
-
83
-
84
-
85
-
86
-
87
-
88
-
89
-
90
-
91
-
92
-
93
-
94
-
95
-
96
-
97
-
98
-
99
-
100
-
101
-
102
-
103
-
104
-
105
-
106
-
107
-
108
-
109
-
110
-
111
-
112
-
113
-
114
-
115
-
116
-
117
-
118
-
119
-
120
-
121
-
122
-
123
-
124
-
125
-
126
-
127
-
128
-
129
-
130
-
131
-
132
-
133
-
134
-
135
-
136
-
137
-
138
-
 139
139 -
 140
140 -
 141
141 -
 142
142 -
 143
143 -
 144
144 -
 145
145 -
 146
146 -
 147
147 -
 148
148 -
 149
149 -
 150
150 -
 151
151 -
 152
152 -
 153
153 -
 154
154 -
 155
155 -
 156
156 -
 157
157 -
 158
158 -
 159
159 -
160
-
161
-
162
-
163
-
164
-
165
-
166
-
167
-
168
-
169
-
170
-
171
-
172
-
173
-
174
 |
 |

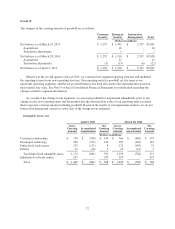
There have been no transfers between fair value measurement levels during fiscal 2015. The following table
summarizes our assets measured at fair value on a recurring basis, by level, within the fair value hierarchy:
April 3, 2015 March 28, 2014
Fair value
Cash and
cash
equivalents
Short-term
investments Fair value
Cash and
cash
equivalents
Short-term
investments
(Dollars in millions)
Cash $ 807 $ 807 $ - $ 922 $ 922 $ -
Non-negotiable certificates of
deposit 296 260 36 405 365 40
Level 1
Money market 1,725 1,725 - 2,380 2,380 -
U.S. government securities 284 - 284 95 - 95
Marketable equity securities 5 - 5 6 - 6
2,014 1,725 289 2,481 2,380 101
Level 2
Corporate bonds 166 - 166 123 3 120
U.S. agency securities 68 - 68 45 - 45
Commercial paper 333 82 251 56 32 24
Negotiable certificates of deposit 184 - 184 - - -
International government
securities 23 - 23 52 5 47
774 82 692 276 40 236
Total $ 3,891 $ 2,874 $ 1,017 $ 4,084 $ 3,707 $ 377
Fair Value of Debt
As of April 3, 2015 and March 28, 2014, the fair value of our current and long-term debt was $2.2 billion
based on Level 2 inputs.
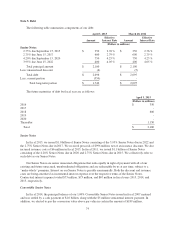
Note 3. Goodwill and Intangible Assets
During fiscal 2015, 2014, and 2013 we completed business acquisitions primarily to enhance our technology
portfolio for aggregate cash consideration, net of cash acquired, of $19 million, $17 million, and $28 million,
respectively. The results of operations related to these acquisitions have been included in our consolidated
statements of income from the acquisition date. Pro forma results of operations have not been presented because
the acquisitions were not material to our results of operations.
We also acquired rights to certain technology for $20 million in an asset acquisition during the third quarter
of fiscal 2015. The total amount assigned to acquired finite-lived intangible assets from fiscal 2015 acquisitions
was $27 million. This cost was assigned to developed technology and is being amortized to cost of revenue on a
straight-line basis over the weighted-average useful life of 3.5 years. Goodwill related to the business
acquisitions is summarized in the following table.
71