Symantec 2015 Annual Report Download - page 108
Download and view the complete annual report
Please find page 108 of the 2015 Symantec annual report below. You can navigate through the pages in the report by either clicking on the pages listed below, or by using the keyword search tool below to find specific information within the annual report.-
 1
1 -
2
-
3
-
4
-
5
-
6
-
7
-
8
-
9
-
10
-
11
-
12
-
13
-
14
-
15
-
16
-
17
-
18
-
19
-
20
-
21
-
22
-
23
-
24
-
25
-
26
-
27
-
28
-
29
-
30
-
31
-
32
-
33
-
34
-
35
-
36
-
37
-
38
-
39
-
40
-
41
-
42
-
43
-
44
-
45
-
46
-
47
-
48
-
49
-
50
-
51
-
52
-
53
-
54
-
55
-
56
-
57
-
58
-
59
-
60
-
61
-
62
-
63
-
64
-
65
-
66
-
67
-
68
-
69
-
70
-
71
-
72
-
73
-
74
-
75
-
76
-
77
-
78
-
79
-
80
-
81
-
82
-
83
-
84
-
85
-
86
-
87
-
88
-
89
-
90
-
91
-
92
-
93
-
94
-
95
-
96
-
97
-
 98
98 -
 99
99 -
 100
100 -
 101
101 -
 102
102 -
 103
103 -
 104
104 -
 105
105 -
 106
106 -
 107
107 -
 108
108 -
 109
109 -
 110
110 -
 111
111 -
 112
112 -
 113
113 -
 114
114 -
 115
115 -
 116
116 -
 117
117 -
 118
118 -
119
-
120
-
121
-
122
-
123
-
124
-
125
-
126
-
127
-
128
-
129
-
130
-
131
-
132
-
133
-
134
-
135
-
136
-
137
-
138
-
139
-
140
-
141
-
142
-
143
-
144
-
145
-
146
-
147
-
148
-
149
-
150
-
151
-
152
-
153
-
154
-
155
-
156
-
157
-
158
-
159
-
160
-
161
-
162
-
163
-
164
-
165
-
166
-
167
-
168
-
169
-
170
-
171
-
172
-
173
-
174
 |
 |

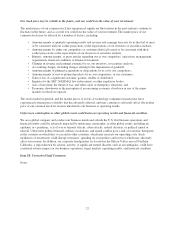
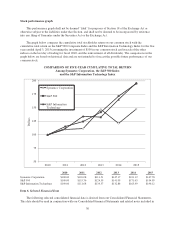
Stock performance graph
This performance graph shall not be deemed “filed” for purposes of Section 18 of the Exchange Act or
otherwise subject to the liabilities under that Section, and shall not be deemed to be incorporated by reference
into any filing of Symantec under the Securities Act or the Exchange Act.
The graph below compares the cumulative total stockholder return on our common stock with the
cumulative total return on the S&P 500 Composite Index and the S&P Information Technology Index for the five
years ended April 3, 2015 (assuming the investment of $100 in our common stock and in each of the other
indices on the last day of trading for fiscal 2010, and the reinvestment of all dividends). The comparisons in the
graph below are based on historical data and are not intended to forecast the possible future performance of our
common stock.
COMPARISON OF FIVE-YEAR CUMULATIVE TOTAL RETURN
Among Symantec Corporation, the S&P 500 Index
and the S&P Information Technology Index
Dollars
2010 2011 2012 2013 2014 2015
50
75
100
125
150
175
200
Symantec Corporation
S&P 500
S&P Information
Technology
2010 2011 2012 2013 2014 2015
Symantec Corporation $100.00 $110.08 $111.51 $147.17 $121.12 $147.78
S&P 500 $100.00 $115.36 $124.59 $141.99 $171.65 $194.99
S&P Information Technology $100.00 $111.68 $134.37 $132.86 $165.49 $196.12
Item 6. Selected Financial Data
The following selected consolidated financial data is derived from our Consolidated Financial Statements.
This data should be read in conjunction with our Consolidated Financial Statements and related notes included in
30