Symantec 2015 Annual Report Download - page 158
Download and view the complete annual report
Please find page 158 of the 2015 Symantec annual report below. You can navigate through the pages in the report by either clicking on the pages listed below, or by using the keyword search tool below to find specific information within the annual report.-
 1
1 -
2
-
3
-
4
-
5
-
6
-
7
-
8
-
9
-
10
-
11
-
12
-
13
-
14
-
15
-
16
-
17
-
18
-
19
-
20
-
21
-
22
-
23
-
24
-
25
-
26
-
27
-
28
-
29
-
30
-
31
-
32
-
33
-
34
-
35
-
36
-
37
-
38
-
39
-
40
-
41
-
42
-
43
-
44
-
45
-
46
-
47
-
48
-
49
-
50
-
51
-
52
-
53
-
54
-
55
-
56
-
57
-
58
-
59
-
60
-
61
-
62
-
63
-
64
-
65
-
66
-
67
-
68
-
69
-
70
-
71
-
72
-
73
-
74
-
75
-
76
-
77
-
78
-
79
-
80
-
81
-
82
-
83
-
84
-
85
-
86
-
87
-
88
-
89
-
90
-
91
-
92
-
93
-
94
-
95
-
96
-
97
-
98
-
99
-
100
-
101
-
102
-
103
-
104
-
105
-
106
-
107
-
108
-
109
-
110
-
111
-
112
-
113
-
114
-
115
-
116
-
117
-
118
-
119
-
120
-
121
-
122
-
123
-
124
-
125
-
126
-
127
-
128
-
129
-
130
-
131
-
132
-
133
-
134
-
135
-
136
-
137
-
138
-
139
-
140
-
141
-
142
-
143
-
144
-
145
-
146
-
147
-
 148
148 -
 149
149 -
 150
150 -
 151
151 -
 152
152 -
 153
153 -
 154
154 -
 155
155 -
 156
156 -
 157
157 -
 158
158 -
 159
159 -
 160
160 -
 161
161 -
 162
162 -
 163
163 -
 164
164 -
 165
165 -
 166
166 -
 167
167 -
 168
168 -
169
-
170
-
171
-
172
-
173
-
174
 |
 |

There were no intersegment sales for the periods presented. The historical information presented has been
retrospectively adjusted to reflect the new segment reporting. Our CODM evaluates performance primarily based
on net revenue and operating income. Except for goodwill, as disclosed in Note 3, our assets are not discretely
identified by segment.
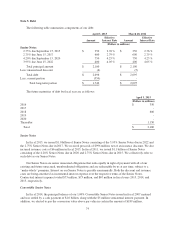
Consumer
Security
Enterprise
Security
Information
Management Total Segments
(Dollars in millions)
Fiscal 2015
Net revenue $ 1,887 $ 2,063 $ 2,558 $ 6,508
Operating income 982 287 486 1,755
Fiscal 2014
Net revenue $ 2,063 $ 2,100 $ 2,513 $ 6,676
Operating income 928 314 571 1,813
Fiscal 2013
Net revenue $ 2,109 $ 2,168 $ 2,629 $ 6,906
Operating income 805 213 684 1,702
The following table provides a reconciliation of the total of the reportable segments’ operating income to the
consolidated operating income:
Year Ended
April 3,
2015
March 28,
2014
March 29,
2013
(Dollars in millions)
Total segment operating income $ 1,755 $ 1,813 $ 1,702
Less reconciling items:
Stock-based compensation 195 156 164
Amortization of intangibles 159 210 355
Restructuring, separation, and transition 252 264 77
Total consolidated operating income $ 1,149 $ 1,183 $ 1,106
Product revenue information
The following table summarizes revenue by significant product categories:
Year Ended
April 3,
2015
March 28,
2014
March 29,
2013
(Dollars in millions)
Core consumer security $ 1,887 $ 2,063 $ 2,109
Backup 1,536 1,423 1,445
Information availability 585 652 733
Endpoint security and management 604 638 701
Others (1) 1,896 1,900 1,918
Total product revenue $ 6,508 $ 6,676 $ 6,906
(1) No other product category was material to the respective totals.
80