Symantec 2015 Annual Report Download - page 60
Download and view the complete annual report
Please find page 60 of the 2015 Symantec annual report below. You can navigate through the pages in the report by either clicking on the pages listed below, or by using the keyword search tool below to find specific information within the annual report.-
 1
1 -
2
-
3
-
4
-
5
-
6
-
7
-
8
-
9
-
10
-
11
-
12
-
13
-
14
-
15
-
16
-
17
-
18
-
19
-
20
-
21
-
22
-
23
-
24
-
25
-
26
-
27
-
28
-
29
-
30
-
31
-
32
-
33
-
34
-
35
-
36
-
37
-
38
-
39
-
40
-
41
-
42
-
43
-
44
-
45
-
46
-
47
-
48
-
49
-
 50
50 -
 51
51 -
 52
52 -
 53
53 -
 54
54 -
 55
55 -
 56
56 -
 57
57 -
 58
58 -
 59
59 -
 60
60 -
 61
61 -
 62
62 -
 63
63 -
 64
64 -
 65
65 -
 66
66 -
 67
67 -
 68
68 -
 69
69 -
 70
70 -
71
-
72
-
73
-
74
-
75
-
76
-
77
-
78
-
79
-
80
-
81
-
82
-
83
-
84
-
85
-
86
-
87
-
88
-
89
-
90
-
91
-
92
-
93
-
94
-
95
-
96
-
97
-
98
-
99
-
100
-
101
-
102
-
103
-
104
-
105
-
106
-
107
-
108
-
109
-
110
-
111
-
112
-
113
-
114
-
115
-
116
-
117
-
118
-
119
-
120
-
121
-
122
-
123
-
124
-
125
-
126
-
127
-
128
-
129
-
130
-
131
-
132
-
133
-
134
-
135
-
136
-
137
-
138
-
139
-
140
-
141
-
142
-
143
-
144
-
145
-
146
-
147
-
148
-
149
-
150
-
151
-
152
-
153
-
154
-
155
-
156
-
157
-
158
-
159
-
160
-
161
-
162
-
163
-
164
-
165
-
166
-
167
-
168
-
169
-
170
-
171
-
172
-
173
-
174
 |
 |

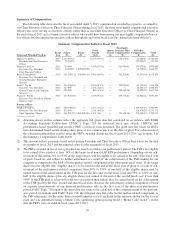
Summary of Compensation
The following table shows for the fiscal year ended April 3, 2015, compensation awarded to or paid to, or earned by,
our Chief Executive Officer or Chief Financial Officer during fiscal 2015, the three most highly compensated executive
officers who were serving as executive officers (other than as our Chief Executive Officer or Chief Financial Officer) at
the end of fiscal 2015 and a former executive officer who would have been among our most highly compensated execu-
tive officers had he remained an executive officer through the end of the fiscal year (the “named executive officers”).
Summary Compensation Table for Fiscal 2015
Name and Principal Position
Fiscal
Year
Salary
($)
Bonus
($)
Stock
Awards
($)(1)
Option
Awards
($)
Non-Equity
Incentive Plan
Compensation
($)
All Other
Compensation
($)
Total
($)
Michael A. Brown ................ 2015 1,473,077(2) — 14,177,180(3) — 658,176(4) 22,000(5) 16,330,433
President and Chief Executive
Officer
2014 36,364(6) — — — — 340,000(7) 376,364
Thomas J. Seifert ................. 2015 720,000 — 4,394,834(3) — 612,000(4) 174,055(8) 5,900,889
Executive Vice President,
Chief Financial Officer
2014 30,000(9) 1,800,000(10) — — — 14,702(11) 1,844,702
Balaji Yelamanchili ............... 2015 281,345(12) 500,000(13) 7,042,854(3) — 342,125(4) 13,531(14) 8,179,855
Executive Vice President and
General Manager, Enterprise
Security
Scott C. Taylor ................... 2015 536,250(15) — 2,326,081(3) — 392,900(4) 63,323(16) 3,318,554
Executive Vice President, 2014 420,000 — 2,136,428(3) — — 28,443(17) 2,584,871
General Counsel and Corporate
Secretary
2013 420,000 — 883,575(3) — 289,380(18) 14,599(19) 1,607,554
Francis C. Rosch ................. 2015 435,923(20) — 2,190,974(3) — 409,715(4) 54,885(21) 3,091,497
Executive Vice President, Norton
Business Unit
Former Officer
Stephen E. Gillett ................. 2015 600,160(22) — 4,375,478(3) — — 1,529,353(23) 6,504,991
Executive Vice President and 2014 875,000 — 3,101,493(3) — — 318,679(24) 4,295,172
Chief Operating Officer 2013 241,951(25) 3,865,000(26) 1,021,506 — 321,858(18) 270,000(27) 5,720,315
(1) Amounts shown in this column reflect the aggregate full grant date fair calculated in accordance with FASB
Accounting Standards Codification (“FASC”) Topic 718 for restricted stock unit awards (“RSU”s) and
performance-based restricted unit awards (“PRU”s) in fiscal years presented. The grant date fair values for RSUs
were determined based on the closing share price of our common stock on the date of grant. For a discussion of
the valuation methodology used to value the PRUs awarded during the fiscal years 2013-2015, see footnote 3 to
the Summary Compensation Table below.
(2) This amount reflects payments based on his interim President and Chief Executive Officer base salary for the first
six months of fiscal 2015 and his adjusted salary for the remainder of fiscal 2015.
(3) The PRUs awarded in fiscal years presented are based on a three-year performance period. The PRUs are eligible
to be earned if we achieve at least 70% of the target level non-GAAP EPS performance. Depending on our ach-
ievement of this metric, 0% to 133% of the target shares will be eligible to be earned at the end of the fiscal year
of grant, based on, and subject to further adjustment as a result of, the achievement of the TSR ranking for our
company as compared to the S&P 500 (the market-related component) in the subsequent fiscal years. If any target
shares become eligible (the “eligible shares”) to be earned at the end of the fiscal year of grant as a result of ach-
ievement of the performance-related component, then 50% to 150% of one-half of the eligible shares may be
earned based on the achievement of the TSR goal for the first and second fiscal years and 50% to 150% of one-
half of the eligible shares (plus any eligible shares not earned at the end of the second fiscal year if less than
100% of the TSR goal is achieved for the two-year period then ended) may be earned based on the achievement
of the TSR goal for the first, second and third fiscal years. Because the performance-related component is based
on separate measurements of our financial performance only in the first year of the three-year performance
period, FASC Topic 718 requires the grant date fair value to be calculated at the commencement of the perform-
ance period. Consistent with FASC Topic 718, the full grant date fair value for the market-related component, or
the TSR adjustment, for the entire three-year performance cycle is included in the amounts shown for the year of
grant and was determined using a Monte Carlo simulation option pricing model (“Monte Carlo model”) on the
date the PRUs were awarded in fiscal years 2013-2015.
50