Symantec 2015 Annual Report Download - page 6
Download and view the complete annual report
Please find page 6 of the 2015 Symantec annual report below. You can navigate through the pages in the report by either clicking on the pages listed below, or by using the keyword search tool below to find specific information within the annual report.-
 1
1 -
 2
2 -
 3
3 -
 4
4 -
 5
5 -
 6
6 -
 7
7 -
 8
8 -
 9
9 -
 10
10 -
 11
11 -
 12
12 -
 13
13 -
 14
14 -
 15
15 -
 16
16 -
 17
17 -
18
-
19
-
20
-
21
-
22
-
23
-
24
-
25
-
26
-
27
-
28
-
29
-
30
-
31
-
32
-
33
-
34
-
35
-
36
-
37
-
38
-
39
-
40
-
41
-
42
-
43
-
44
-
45
-
46
-
47
-
48
-
49
-
50
-
51
-
52
-
53
-
54
-
55
-
56
-
57
-
58
-
59
-
60
-
61
-
62
-
63
-
64
-
65
-
66
-
67
-
68
-
69
-
70
-
71
-
72
-
73
-
74
-
75
-
76
-
77
-
78
-
79
-
80
-
81
-
82
-
83
-
84
-
85
-
86
-
87
-
88
-
89
-
90
-
91
-
92
-
93
-
94
-
95
-
96
-
97
-
98
-
99
-
100
-
101
-
102
-
103
-
104
-
105
-
106
-
107
-
108
-
109
-
110
-
111
-
112
-
113
-
114
-
115
-
116
-
117
-
118
-
119
-
120
-
121
-
122
-
123
-
124
-
125
-
126
-
127
-
128
-
129
-
130
-
131
-
132
-
133
-
134
-
135
-
136
-
137
-
138
-
139
-
140
-
141
-
142
-
143
-
144
-
145
-
146
-
147
-
148
-
149
-
150
-
151
-
152
-
153
-
154
-
155
-
156
-
157
-
158
-
159
-
160
-
161
-
162
-
163
-
164
-
165
-
166
-
167
-
168
-
169
-
170
-
171
-
172
-
173
-
174
 |
 |

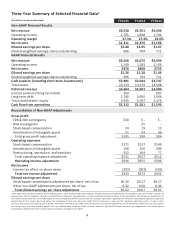
Three Year Summary of Selected Financial Data1
($ in millions, except per share data)
FY2015 FY2014 FY2013
Non-GAAP Financial Results
Net revenue $6,538 $6,701 $6,906
Operating income 1,785 1,838 1,702
Operating margin 27.3% 27.4% 24.6%
Net income $1,311 $1,370 $1,186
Diluted earnings per share $1.88 $1.95 $1.67
Diluted weighted-average shares outstanding 696 704 711
GAAP Financial Results
Net revenue $6,508 $6,676 $6,906
Operating income 1,149 1,183 1,106
Net income $878 $898 $755
Diluted earnings per share $1.26 $1.28 $1.06
Diluted weighted-average shares outstanding 696 704 711
Cash position (including short-term investments) $3,891 $4,084 $4,747
Total assets 13,233 13,539 14,508
Deferred revenue $3,664 $3,903 $4,080
Current portion of long-term debt 350 - 997
Long-term debt 1,746 2,095 2,094
Total stockholders’ equity 5,935 5,797 5,476
Cash flow from operations $1,312 $1,281 $1,593
Reconciliation of Non-GAAP Adjustments
Gross profit
EDS & NDI contingency $30 $ - $ -
GSA investigation - 25 -
Stock-based compensation 24 19 15
Amortization of intangible assets 51 54 69
Total gross profit adjustment $105 $98 $84
Operating expenses
Stock-based compensation $171 $137 $149
Amortization of intangible assets 108 156 286
Restructuring, separation, and transition 252 264 77
Total operating expense adjustment $531 $557 $512
Operating income adjustment $636 $655 $596
Net income
Income tax effect on above items (203) (183) (165)
Total net Income adjustment $433 $472 $431
Diluted earnings per share
Stock-based compensation adjustment per share, net of tax $0.20 $0.17 $0.17
Other non-GAAP adjustments per share, net of tax 0.42 0.50 0.44
Total diluted earnings per share adjustment $0.62 $0.67 $0.61
1Non-GAAP financial measures adjust for the following items: stock-based compensation expense; charges related to the amortization of intangible assets; certain other income and
expense items that management considers unrelated to the Company’s core operations; and the associated income tax effects of the adjustments. We believe our presentation of
non-GAAP financial measures, when taken together with corresponding GAAP financial measures, provides meaningful supplemental information regarding the Company’s operating
performance for the reasons discussed below. Our management team uses these non-GAAP financial measures in assessing the Company’s operating results, as well as when
planning, forecasting and analyzing future periods. We believe that these non-GAAP financial measures also facilitate comparisons of the Company’s performance to prior periods
and to our peers and that investors benefit from an understanding of the non-GAAP financial measures. Non-GAAP financial measures are supplemental and should not be
considered a substitute for financial information presented in accordance with GAAP.
4