Symantec 2015 Annual Report Download - page 47
Download and view the complete annual report
Please find page 47 of the 2015 Symantec annual report below. You can navigate through the pages in the report by either clicking on the pages listed below, or by using the keyword search tool below to find specific information within the annual report.-
 1
1 -
2
-
3
-
4
-
5
-
6
-
7
-
8
-
9
-
10
-
11
-
12
-
13
-
14
-
15
-
16
-
17
-
18
-
19
-
20
-
21
-
22
-
23
-
24
-
25
-
26
-
27
-
28
-
29
-
30
-
31
-
32
-
33
-
34
-
35
-
36
-
 37
37 -
 38
38 -
 39
39 -
 40
40 -
 41
41 -
 42
42 -
 43
43 -
 44
44 -
 45
45 -
 46
46 -
 47
47 -
 48
48 -
 49
49 -
 50
50 -
 51
51 -
 52
52 -
 53
53 -
 54
54 -
 55
55 -
 56
56 -
 57
57 -
58
-
59
-
60
-
61
-
62
-
63
-
64
-
65
-
66
-
67
-
68
-
69
-
70
-
71
-
72
-
73
-
74
-
75
-
76
-
77
-
78
-
79
-
80
-
81
-
82
-
83
-
84
-
85
-
86
-
87
-
88
-
89
-
90
-
91
-
92
-
93
-
94
-
95
-
96
-
97
-
98
-
99
-
100
-
101
-
102
-
103
-
104
-
105
-
106
-
107
-
108
-
109
-
110
-
111
-
112
-
113
-
114
-
115
-
116
-
117
-
118
-
119
-
120
-
121
-
122
-
123
-
124
-
125
-
126
-
127
-
128
-
129
-
130
-
131
-
132
-
133
-
134
-
135
-
136
-
137
-
138
-
139
-
140
-
141
-
142
-
143
-
144
-
145
-
146
-
147
-
148
-
149
-
150
-
151
-
152
-
153
-
154
-
155
-
156
-
157
-
158
-
159
-
160
-
161
-
162
-
163
-
164
-
165
-
166
-
167
-
168
-
169
-
170
-
171
-
172
-
173
-
174
 |
 |

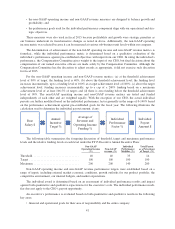
The percentage of an executive officer’s compensation opportunity that is “at-risk,” or variable instead of
fixed, is based primarily on the officer’s level of influence at Symantec. Executive officers generally have a
greater portion of their pay at risk through short- and long-term incentive programs than the rest of our employee
population because of their relatively greater responsibility and ability to influence our company’s performance.
Typically, a higher proportion of the CEO’s compensation opportunity is at-risk relative to our other named
executive officers because the nature of his role and ability to influence our company’s performance. As illus-
trated by the following charts, for fiscal 2015, approximately 94% of our CEO’s target total direct compensation
(sum of base salary, target annual incentive and grant date fair value of equity award) was at-risk, and on average
approximately 88% of our other named executive officers’ compensation opportunity was at-risk compensation.
FY15 CEO Target Total Direct Compensation Mix FY15 Other NEO Target Total Direct Compensation Mix
Base 12%
PRU 26%
RSU 52%
Annual
Incentive 11%
At-Risk
Compensation
88%
Base
6%
PRU 64%
Annual
Incentive
9%
RSU 21%
At-Risk
Compensation
94%
Form and Mix of Long-Term Equity Incentive Compensation: The long-term equity incentive
compensation component of our regular annual executive compensation program typically consists of PRUs and
RSUs for all of our named executive officers. We believed these allocations would strike the appropriate balance
between performance and retention for long-term equity incentive awards.
For fiscal 2015, our CEO received approximately 64% of the value of his target total direct compensation in
the form of PRUs and 21% in RSUs. Other named executive officers, received on average, approximately 29% of
the target total direct compensation in the form of PRUs and 47% in RSUs. We view the meaningfully higher
weighting of PRUs for the CEO and lower weighting of base salary as part of total direct compensation, as
compared to the weighting for the other NEOs, to be appropriate given both the level of total direct compensation
and the broader level of influence over company performance associated with the CEO role.
These percentages (and other percentage-based equity awards values discussed below) are based on the
grant date fair value of the shares of common stock underlying the RSUs, and the grant date fair value of the
PRUs at the target level award size. The awards made to our named executive officers, other than the CEO, are
determined by the Compensation Committee after reviewing recommendations made by the CEO. In determining
its recommendations to the independent directors of the Board, in the case of CEO compensation, and in making
compensation decisions with respect to other named executive officers, the Compensation Committee may con-
sider factors such as the individual’s responsibilities, the individual’s performance, industry experience, current
pay mix, total compensation competitiveness, long-term equity awards previously granted to the individual,
retention considerations, and other factors.
Compensation Risk Assessment: The Compensation Committee, in consultation with Mercer, has con-
ducted its annual risk analysis on Symantec’s compensation policies and practices, and does not believe that our
compensation programs encourage excessive or inappropriate risk taking by our executives or are reasonably
likely to have a material adverse effect on Symantec.
37