Symantec 2015 Annual Report Download - page 63
Download and view the complete annual report
Please find page 63 of the 2015 Symantec annual report below. You can navigate through the pages in the report by either clicking on the pages listed below, or by using the keyword search tool below to find specific information within the annual report.-
 1
1 -
2
-
3
-
4
-
5
-
6
-
7
-
8
-
9
-
10
-
11
-
12
-
13
-
14
-
15
-
16
-
17
-
18
-
19
-
20
-
21
-
22
-
23
-
24
-
25
-
26
-
27
-
28
-
29
-
30
-
31
-
32
-
33
-
34
-
35
-
36
-
37
-
38
-
39
-
40
-
41
-
42
-
43
-
44
-
45
-
46
-
47
-
48
-
49
-
50
-
51
-
52
-
 53
53 -
 54
54 -
 55
55 -
 56
56 -
 57
57 -
 58
58 -
 59
59 -
 60
60 -
 61
61 -
 62
62 -
 63
63 -
 64
64 -
 65
65 -
 66
66 -
 67
67 -
 68
68 -
 69
69 -
 70
70 -
 71
71 -
 72
72 -
 73
73 -
74
-
75
-
76
-
77
-
78
-
79
-
80
-
81
-
82
-
83
-
84
-
85
-
86
-
87
-
88
-
89
-
90
-
91
-
92
-
93
-
94
-
95
-
96
-
97
-
98
-
99
-
100
-
101
-
102
-
103
-
104
-
105
-
106
-
107
-
108
-
109
-
110
-
111
-
112
-
113
-
114
-
115
-
116
-
117
-
118
-
119
-
120
-
121
-
122
-
123
-
124
-
125
-
126
-
127
-
128
-
129
-
130
-
131
-
132
-
133
-
134
-
135
-
136
-
137
-
138
-
139
-
140
-
141
-
142
-
143
-
144
-
145
-
146
-
147
-
148
-
149
-
150
-
151
-
152
-
153
-
154
-
155
-
156
-
157
-
158
-
159
-
160
-
161
-
162
-
163
-
164
-
165
-
166
-
167
-
168
-
169
-
170
-
171
-
172
-
173
-
174
 |
 |

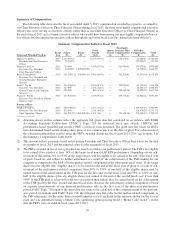
(27) Represents the following non-employee director compensation paid to Mr. Gillett prior to his becoming our Executive
Vice President and Chief Operating Officer in December 2012:
Fees Earned
or Paid in Cash
($)*
Stock
Awards
($)†**
Total
($)
20,013†† 249,987†† 270,000
* Mr. Gillett received an annual fee of $20,000 for serving on the Audit Committee.
†Amounts shown in this column reflect the aggregate full grant date fair value calculated in accordance with FASC
Topic 718 for awards granted during the fiscal year.
** Mr. Gillett was granted 12,547 RSUs on May 7, 2012, with a per share fair value of $15.94 and a full grant date
fair value of $199,999.
†† In lieu of cash, Mr. Gillett received 100% of his annual retainer fee of $50,000 in the form of our common stock.
Accordingly, pursuant to the terms of the 2000 Director Equity Incentive Plan, he was granted 3,136 shares at a
per share fair value of $15.94 and a full grant date fair value of $49,988. The balance of his fee, $13.00, was paid
in cash as reported in the “Fees Earned or Paid in Cash” column in the table above.
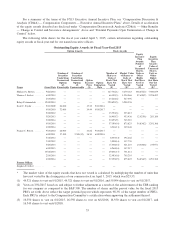
The following table shows for the fiscal year ended April 3, 2015, certain information regarding grants of plan-based
awards to our named executive officers from our incentive plans:
Grants of Plan-Based Awards in Fiscal 2015
Estimated Future Payouts
Under Non-Equity Incentive Plan
Awards(2)
Estimated Future Payouts
Under Equity Incentive
Plan Awards(3)
All Other
Stock
Awards:
Number
of Shares
of Stock
or Units(4)
(#)
All Other
Option
Awards:
Number
of
Securities
Underlying
Options
(#)
Exercise or
Base Price
of Option
Awards
($/Sh)
Grant
Date
Fair
Value
of Stock
and
Option
Awards
($)Name
Grant
Date(1)
Threshold
($)
Target
($)
Maximum
($)
Threshold
(#)
Target
(#)
Maximum
(#)
Michael A. Brown . . . 09/24/14 600,000 1,500,000 3,000,000 — — — 147,736(4) — — 3,567,824
09/24/14 172,358 344,717 687,710 — — — 10,609,355
Thomas J. Seifert .... 06/10/14 100,800 720,000 2,016,000 — — — 66,199(5) — — 1,409,377
06/10/14 — — — 23,244(6) — — 494,865
06/10/14 49,649 99,298 198,099 — — — 2,490,592
Balaji Yelamanchili . . 12/10/14 122,500 875,000 2,450,000 — — — 276,028(7) — — 7,042,854
Scott C. Taylor ......06/10/14 51,744 369,600 1,034,880 — — — 37,190(5) — — 791,775
06/10/14 — — — 6,346(8) — — 135,106
06/10/14 27,892 55,785 111,291 — — — 1,399,199
Francis C. Rosch .... 06/10/14 48,190 344,216 963,805 — — — 37,190(5) — — 791,775
06/10/14 27,892 55,785 111,291 — — — 1,399,199
Former Officer
Stephen E. Gillett .... 06/10/14 153,125 1,093,750 3,062,500 — — — 65,083(5) — — 1,385,617
06/10/14 — — — 25,423(8) — — 541,256
06/10/14 48,812 97,624 194,759 — — — 2,448,605
(1) Represents grant date of stock awards.
(2) Represents threshold, target and maximum payouts with respect to each applicable metric under the FY15 Executive
Annual Incentive Plan.
(3) The amounts shown in these rows reflect, in share amounts, the threshold, target, and maximum potential eligible shares
to be earned (based on performance for the fiscal 2015 period) at the end of fiscal 2016 and 2017, based on, and subject
to further adjustment as a result of, the achievement of the TSR ranking for our company as compared to the S&P 500, as
further described in the CD&A section beginning on page 43. In May 2014 all named executive officers were awarded a
PRU under the 2013 Equity Incentive Plan, eligible to be earned if we achieve at least 70% of the target level non-GAAP
53