Symantec 2015 Annual Report Download - page 119
Download and view the complete annual report
Please find page 119 of the 2015 Symantec annual report below. You can navigate through the pages in the report by either clicking on the pages listed below, or by using the keyword search tool below to find specific information within the annual report.-
 1
1 -
2
-
3
-
4
-
5
-
6
-
7
-
8
-
9
-
10
-
11
-
12
-
13
-
14
-
15
-
16
-
17
-
18
-
19
-
20
-
21
-
22
-
23
-
24
-
25
-
26
-
27
-
28
-
29
-
30
-
31
-
32
-
33
-
34
-
35
-
36
-
37
-
38
-
39
-
40
-
41
-
42
-
43
-
44
-
45
-
46
-
47
-
48
-
49
-
50
-
51
-
52
-
53
-
54
-
55
-
56
-
57
-
58
-
59
-
60
-
61
-
62
-
63
-
64
-
65
-
66
-
67
-
68
-
69
-
70
-
71
-
72
-
73
-
74
-
75
-
76
-
77
-
78
-
79
-
80
-
81
-
82
-
83
-
84
-
85
-
86
-
87
-
88
-
89
-
90
-
91
-
92
-
93
-
94
-
95
-
96
-
97
-
98
-
99
-
100
-
101
-
102
-
103
-
104
-
105
-
106
-
107
-
108
-
 109
109 -
 110
110 -
 111
111 -
 112
112 -
 113
113 -
 114
114 -
 115
115 -
 116
116 -
 117
117 -
 118
118 -
 119
119 -
 120
120 -
 121
121 -
 122
122 -
 123
123 -
 124
124 -
 125
125 -
 126
126 -
 127
127 -
 128
128 -
 129
129 -
130
-
131
-
132
-
133
-
134
-
135
-
136
-
137
-
138
-
139
-
140
-
141
-
142
-
143
-
144
-
145
-
146
-
147
-
148
-
149
-
150
-
151
-
152
-
153
-
154
-
155
-
156
-
157
-
158
-
159
-
160
-
161
-
162
-
163
-
164
-
165
-
166
-
167
-
168
-
169
-
170
-
171
-
172
-
173
-
174
 |
 |

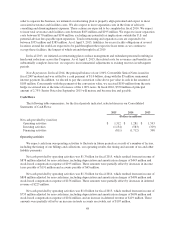
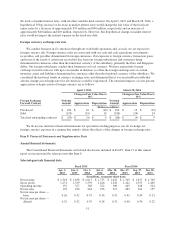
Total net revenue by fiscal year
Change in %
2015 2014 2013 2015 v 2014 2014 v 2013
(Dollars in millions)
Content, subscription, and maintenance revenue $ 5,749 $ 5,960 $ 6,021 (4)% (1)%
License revenue 759 716 885 6% (19)%
Total $ 6,508 $ 6,676 $ 6,906 (3)% (3)%
2015 compared to 2014:
Content, subscription, and maintenance revenue represented 88%, 89% and 87% of total net revenue for the
fiscal years ended 2015, 2014 and 2013, respectively. Content, subscription, and maintenance revenue decreased
$211 million primarily due to the general strengthening of the U.S. dollar against foreign currencies and declines
in our consumer security revenue driven by our channel strategy to exit unprofitable retail arrangements and
certain high-cost OEM arrangements, coupled with the impact of our decision to change our renewal practices.
This was partially offset by an additional week from the 53-week fiscal 2015 year and by increased revenue from
Backup and Recovery products. License revenue increased $43 million primarily due to an increase in sales of
our NetBackup appliances, partially offset by unfavorable foreign currency fluctuations.
2014 compared to 2013:
Content, subscription, and maintenance revenue decreased $61 million primarily due to decreases from our
Consumer Security segment of $30 million and Information Management segment of $26 million. License
revenue decreased $169 million due to declines from our Information Management segment of $89 million,
Enterprise Security segment of $63 million and Consumer Security segment of $17 million.
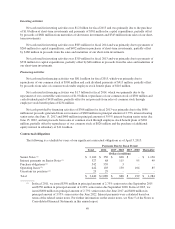
Net revenue and operating income by segment by fiscal year
Change in %
2015 2014 2013 2015 v 2014 2014 v 2013
(Dollars in millions)
Total net revenue:
Consumer Security $ 1,887 $ 2,063 $ 2,109 (9)% (2)%
Enterprise Security 2,063 2,100 2,168 (2)% (3)%
Information Management 2,558 2,513 2,629 2% (4)%
Percentage of total net revenue:
Consumer Security 29% 31% 31%
Enterprise Security 32% 31% 31%
Information Management 39% 38% 38%
Operating income:
Consumer Security $ 982 $ 928 $ 805 6% 15%
Enterprise Security 287 314 213 (9)% 47%
Information Management 486 571 684 (15)% (17)%
Operating margin:
Consumer Security 52% 45% 38%
Enterprise Security 14% 15% 10%
Information Management 19% 23% 26%
41