Symantec 2015 Annual Report Download - page 51
Download and view the complete annual report
Please find page 51 of the 2015 Symantec annual report below. You can navigate through the pages in the report by either clicking on the pages listed below, or by using the keyword search tool below to find specific information within the annual report.-
 1
1 -
2
-
3
-
4
-
5
-
6
-
7
-
8
-
9
-
10
-
11
-
12
-
13
-
14
-
15
-
16
-
17
-
18
-
19
-
20
-
21
-
22
-
23
-
24
-
25
-
26
-
27
-
28
-
29
-
30
-
31
-
32
-
33
-
34
-
35
-
36
-
37
-
38
-
39
-
40
-
 41
41 -
 42
42 -
 43
43 -
 44
44 -
 45
45 -
 46
46 -
 47
47 -
 48
48 -
 49
49 -
 50
50 -
 51
51 -
 52
52 -
 53
53 -
 54
54 -
 55
55 -
 56
56 -
 57
57 -
 58
58 -
 59
59 -
 60
60 -
 61
61 -
62
-
63
-
64
-
65
-
66
-
67
-
68
-
69
-
70
-
71
-
72
-
73
-
74
-
75
-
76
-
77
-
78
-
79
-
80
-
81
-
82
-
83
-
84
-
85
-
86
-
87
-
88
-
89
-
90
-
91
-
92
-
93
-
94
-
95
-
96
-
97
-
98
-
99
-
100
-
101
-
102
-
103
-
104
-
105
-
106
-
107
-
108
-
109
-
110
-
111
-
112
-
113
-
114
-
115
-
116
-
117
-
118
-
119
-
120
-
121
-
122
-
123
-
124
-
125
-
126
-
127
-
128
-
129
-
130
-
131
-
132
-
133
-
134
-
135
-
136
-
137
-
138
-
139
-
140
-
141
-
142
-
143
-
144
-
145
-
146
-
147
-
148
-
149
-
150
-
151
-
152
-
153
-
154
-
155
-
156
-
157
-
158
-
159
-
160
-
161
-
162
-
163
-
164
-
165
-
166
-
167
-
168
-
169
-
170
-
171
-
172
-
173
-
174
 |
 |

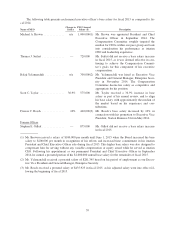
‰the non-GAAP operating income and non-GAAP revenue measures are designed to balance growth and
profitability; and
‰the performance goals used for the individual performance component align with our operational and stra-
tegic objectives.
These measures were also used in fiscal 2015 because profitability and growth were strategic priorities as
our business underwent its transformative changes as noted in above. Additionally, the non-GAAP operating
income metric was selected because it can be measured at various sub-business unit levels within our company.
The determination of achievement of the non-GAAP operating income and non-GAAP revenue metrics is
formulaic, while the individual performance metric is determined based on a qualitative evaluation of the
individual’s performance against pre-established objectives with input from our CEO. In rating the individual’s
performance, the Compensation Committee gives weight to the input of our CEO, but final decisions about the
compensation of our named executive officers are made solely by the Compensation Committee. Although the
Compensation Committee has the discretion to adjust awards as appropriate, it did not exercise such discretion
for fiscal 2015.
For the non-GAAP operating income and non-GAAP revenue metrics: (a) at the threshold achievement
level of 90% of target, the funding level is 40%; (b) above the threshold achievement level, the funding level
increases incrementally, up to a funding level of 100% at a target achievement level of 100%; (c) above the target
achievement level, funding increases incrementally, up to a cap of a 200% funding based on a maximum
achievement level of at least 106.5% of target; and (d) there is zero funding below the threshold achievement
level of 90%. The non-GAAP operating income and non-GAAP revenue metrics are tested and funded
independently of each other and are weighted equally. With the exception of our CEO, the actual individual
payouts are further modified based on the individual performance factor generally in the range of 0-140% based
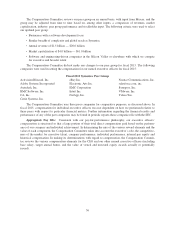
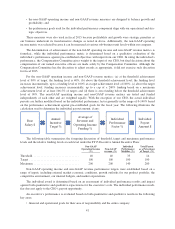
on the performance achievement against pre-established goals for the fiscal year. The following illustrates the
calculation used to determine the individual payout amount, if any:
Base
Salary $
Annual
Incentive
Target %
Average of
Revenue and
Operating Income
Funding %
Individual
Performance
Factor %
Individual
Payout
Amount $
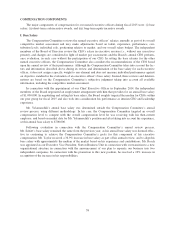
The following table summarizes the foregoing discussion of threshold, target and maximum performance
levels and the relative funding levels at each level under the FY15 Executive Annual Incentive Plans:
Non-GAAP
Operating Income
(%)
Non-GAAP
revenue (%)
Individual
Performance
Modifier (%)
Total Payout
as a Percentage
of Target (%)
Threshold ............................... 40 40 35 14
Target .................................. 100 100 100 100
Maximum ............................... 200 200 140 280
Non-GAAP operating income and non-GAAP revenue performance targets were established based on a
range of inputs, including external market economic conditions, growth outlooks for our product portfolio, the
competitive environment, our internal budgets, and market expectations.
The individual award is determined based on an assessment of individual performance results and impact
against both quantitative and qualitative expectations for the executive’s role. The individual performance modi-
fier does not apply to the CEO’s payout opportunity.
An executive’s performance is evaluated based on both quantitative and qualitative results in the following
key areas:
‰financial and operational goals for their area of responsibility and the entire company;
41