Symantec 2015 Annual Report Download - page 129
Download and view the complete annual report
Please find page 129 of the 2015 Symantec annual report below. You can navigate through the pages in the report by either clicking on the pages listed below, or by using the keyword search tool below to find specific information within the annual report.-
 1
1 -
2
-
3
-
4
-
5
-
6
-
7
-
8
-
9
-
10
-
11
-
12
-
13
-
14
-
15
-
16
-
17
-
18
-
19
-
20
-
21
-
22
-
23
-
24
-
25
-
26
-
27
-
28
-
29
-
30
-
31
-
32
-
33
-
34
-
35
-
36
-
37
-
38
-
39
-
40
-
41
-
42
-
43
-
44
-
45
-
46
-
47
-
48
-
49
-
50
-
51
-
52
-
53
-
54
-
55
-
56
-
57
-
58
-
59
-
60
-
61
-
62
-
63
-
64
-
65
-
66
-
67
-
68
-
69
-
70
-
71
-
72
-
73
-
74
-
75
-
76
-
77
-
78
-
79
-
80
-
81
-
82
-
83
-
84
-
85
-
86
-
87
-
88
-
89
-
90
-
91
-
92
-
93
-
94
-
95
-
96
-
97
-
98
-
99
-
100
-
101
-
102
-
103
-
104
-
105
-
106
-
107
-
108
-
109
-
110
-
111
-
112
-
113
-
114
-
115
-
116
-
117
-
118
-
 119
119 -
 120
120 -
 121
121 -
 122
122 -
 123
123 -
 124
124 -
 125
125 -
 126
126 -
 127
127 -
 128
128 -
 129
129 -
 130
130 -
 131
131 -
 132
132 -
 133
133 -
 134
134 -
 135
135 -
 136
136 -
 137
137 -
 138
138 -
 139
139 -
140
-
141
-
142
-
143
-
144
-
145
-
146
-
147
-
148
-
149
-
150
-
151
-
152
-
153
-
154
-
155
-
156
-
157
-
158
-
159
-
160
-
161
-
162
-
163
-
164
-
165
-
166
-
167
-
168
-
169
-
170
-
171
-
172
-
173
-
174
 |
 |

the levels of market interest rates, with all other variables held constant. On April 3, 2015 and March 28, 2014, a
hypothetical 50 bps increase or decrease in market interest rates would change the fair value of the fixed-rate
senior notes by a decrease of approximately $39 million and $48 million, respectively and an increase of
approximately $40 million and $49 million, respectively. However, this hypothetical change in market interest
rates would not impact the interest expense on the fixed-rate debt.
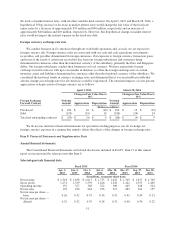
Foreign currency exchange rate risk
We conduct business in 43 currencies through our worldwide operations and, as such, we are exposed to
foreign currency risk. Foreign currency risks are associated with our cash and cash equivalents, investments,
receivables, and payables denominated in foreign currencies. Our exposure to foreign currency transaction gains
and losses is the result of certain net receivables due from our foreign subsidiaries and customers being
denominated in currencies other than the functional currency of the subsidiary, primarily the Euro and Singapore
dollar. Our foreign subsidiaries conduct their businesses in local currency. We have entered into foreign
exchange forward contracts with up to six months in duration, to offset the foreign exchange risk on certain
monetary assets and liabilities denominated in currencies other than the functional currency of the subsidiary. We
considered the historical trends in currency exchange rates and determined that it was reasonably possible that
adverse changes in exchange rates for all currencies could be experienced. The estimated impacts of a ten percent
appreciation or depreciation of foreign currency are as follows:
April 3, 2015 March 28, 2014
Change in Fair Value Due to
10%
Change in Fair Value Due to
10%
Foreign Exchange
Forward Contract
Notional
Amount Appreciation Depreciation
Notional
Amount Appreciation Depreciation
(Dollars in millions)
Purchased $ 102 $ 10 $ (10) $ 154 $ 15 $ (15)
Sold (195) (19) 19 (240) (24) 24
Total net outstanding contracts $ (93) $ (9) $ 9 $ (86) $ (9) $ 9
We do not use derivative financial instruments for speculative trading purposes, nor do we hedge our
foreign currency exposure in a manner that entirely offsets the effects of the changes in foreign exchange rates.
Item 8. Financial Statements and Supplementary Data
Annual financial statements
The Consolidated Financial Statements and related disclosures included in Part IV, Item 15 of this annual
report are incorporated by reference into this Item 8.
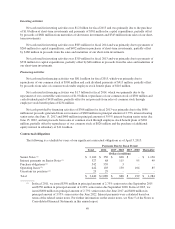
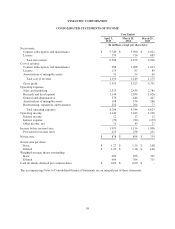
Selected quarterly financial data
Fiscal 2015 Fiscal 2014
Apr. 3,
2015
Jan. 2,
2015
Oct. 3,
2014
Jul. 4,
2014
Mar. 28,
2014
Dec. 27,
2013
Sep. 27,
2013
Jun. 28,
2013
(In millions, except per share data)
Net revenue $ 1,518 $ 1,638 $ 1,617 $ 1,735 $ 1,625 $ 1,705 $ 1,637 $ 1,709
Gross profit 1,231 1,359 1,339 1,426 1,343 1,422 1,353 1,409
Operating income 152 327 348 322 306 405 248 224
Net income 176 222 244 236 217 283 241 157
Net income per share —
basic 0.26 0.32 0.35 0.34 0.31 0.41 0.34 0.23
Net income per share —
diluted 0.25 0.32 0.35 0.34 0.31 0.40 0.34 0.22
51