Symantec 2015 Annual Report Download - page 61
Download and view the complete annual report
Please find page 61 of the 2015 Symantec annual report below. You can navigate through the pages in the report by either clicking on the pages listed below, or by using the keyword search tool below to find specific information within the annual report.-
 1
1 -
2
-
3
-
4
-
5
-
6
-
7
-
8
-
9
-
10
-
11
-
12
-
13
-
14
-
15
-
16
-
17
-
18
-
19
-
20
-
21
-
22
-
23
-
24
-
25
-
26
-
27
-
28
-
29
-
30
-
31
-
32
-
33
-
34
-
35
-
36
-
37
-
38
-
39
-
40
-
41
-
42
-
43
-
44
-
45
-
46
-
47
-
48
-
49
-
50
-
 51
51 -
 52
52 -
 53
53 -
 54
54 -
 55
55 -
 56
56 -
 57
57 -
 58
58 -
 59
59 -
 60
60 -
 61
61 -
 62
62 -
 63
63 -
 64
64 -
 65
65 -
 66
66 -
 67
67 -
 68
68 -
 69
69 -
 70
70 -
 71
71 -
72
-
73
-
74
-
75
-
76
-
77
-
78
-
79
-
80
-
81
-
82
-
83
-
84
-
85
-
86
-
87
-
88
-
89
-
90
-
91
-
92
-
93
-
94
-
95
-
96
-
97
-
98
-
99
-
100
-
101
-
102
-
103
-
104
-
105
-
106
-
107
-
108
-
109
-
110
-
111
-
112
-
113
-
114
-
115
-
116
-
117
-
118
-
119
-
120
-
121
-
122
-
123
-
124
-
125
-
126
-
127
-
128
-
129
-
130
-
131
-
132
-
133
-
134
-
135
-
136
-
137
-
138
-
139
-
140
-
141
-
142
-
143
-
144
-
145
-
146
-
147
-
148
-
149
-
150
-
151
-
152
-
153
-
154
-
155
-
156
-
157
-
158
-
159
-
160
-
161
-
162
-
163
-
164
-
165
-
166
-
167
-
168
-
169
-
170
-
171
-
172
-
173
-
174
 |
 |

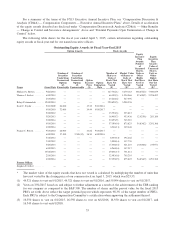
The table below sets forth the grant date fair value determined in accordance with FASC Topic 718 princi-
ples established in fiscal years 2013-2015 for the performance-related component of these awards (i) based
upon the probable outcome of the fiscal years 2013-2015 performance-related component as of the grant
date, and (ii) based upon achieving the maximum level of performance under the fiscal years 2013-2015
performance-related component as of the grant date. Also set forth below are the grant date fair values per-
taining to the market-related component or the TSR adjustment and significant inputs and assumptions used
in the Monte Carlo model, determined upon grant in fiscal years 2013-2015, and which is not subject to
probable or maximum outcome assumptions.
Name
Fiscal
Year
Probable Outcome of
Performance
Conditions Grant
Date Fair Value
($)
Maximum
Outcome of
Performance
Conditions Grant
Date Fair Value
($)
Market-Related
Component Grant
Date Fair Value
($)
Michael A. Brown .................... 2015 9,017,952 14,110,442 10,609,355
Thomas J. Seifert ..................... 2015 2,540,404 3,312,488 2,490,592
Balaji Yelamanchili ................... 2015 — — —
Scott C. Taylor ....................... 2015 1,427,183 1,860,935 1,399,199
2014 606,769 849,476 638,704
2013 538,670 607,145 456,500
Francis C. Rosch ..................... 2015 1,427,183 1,860,935 1,399,199
Stephen E. Gillett ..................... 2015 2,497,577 3,256,645 2,448,605
2014 1,820,331 2,548,464 1,916,138
Grant Date
Grant Date
Fair Value ($) Volatility (%)
Risk-Free
Interest Rate (%)
5/10/2012 .................................. 16.60 32.21 0.36
5/20/2013 .................................. 26.03 28.80 0.38
6/10/2014 .................................. 25.08 26.20 0.84
9/24/2014 .................................. 30.78 22.89 0.84
(4) Represents the executive officer’s annual bonus under the Executive Annual Incentive Plan for fiscal 2015,
which was earned in fiscal 2015 and paid in fiscal 2016.
(5) Represents (a) $10,000 for reimbursement for tax services, and (b) $12,000 for the Company’s con-
tributions to Mr. Brown’s account under its 401(k) plan.
(6) Mr. Brown received a prorated salary of $36,364 based on his period of employment as our interim Presi-
dent and Chief Executive Officer in fiscal 2014.
(7) Represents the following non-employee director compensation paid to Mr. Brown prior to his becoming our
interim President and Chief Executive Officer in March 2014:
Fees Earned
or Paid in Cash
($)*
Stock
Awards
($)†
Total
($)
105,023†† 234,978 340,000
* Mr. Brown received the following annual fees: (i) $50,000 annual retainer fee; (ii) $15,000 for serving
on the Compensation Committee; (ii) $15,000 for serving on the Nominating and Governance
Committee; and (iii) $25,000 for chairing the Compensation Committee.
†Amounts shown in this column reflect the aggregate full grant date fair value calculated in accordance
with FASC Topic 718 for awards granted during the fiscal year.
†† Includes cash payout of $22.50 for fractional share from non-employee director stock award grant.
(8) Represents (a) $154,730 in relocation expenses occurred in fiscal 2015, (b) $7,925 for reimbursement for tax
services, and (c) $11,400 for the Company’s contributions to Mr. Seifert’s account under its 401(k) plan.
(9) Mr. Seifert received a prorated salary of $30,000 based on his period of employment as our Executive Vice
President and Chief Financial Officer in fiscal 2014. His annual base salary is $720,000.
51