Starwood 2008 Annual Report Download - page 98
Download and view the complete annual report
Please find page 98 of the 2008 Starwood annual report below. You can navigate through the pages in the report by either clicking on the pages listed below, or by using the keyword search tool below to find specific information within the annual report.-
 1
1 -
2
-
3
-
4
-
5
-
6
-
7
-
8
-
9
-
10
-
11
-
12
-
13
-
14
-
15
-
16
-
17
-
18
-
19
-
20
-
21
-
22
-
23
-
24
-
25
-
26
-
27
-
28
-
29
-
30
-
31
-
32
-
33
-
34
-
35
-
36
-
37
-
38
-
39
-
40
-
41
-
42
-
43
-
44
-
45
-
46
-
47
-
48
-
49
-
50
-
51
-
52
-
53
-
54
-
55
-
56
-
57
-
58
-
59
-
60
-
61
-
62
-
63
-
64
-
65
-
66
-
67
-
68
-
69
-
70
-
71
-
72
-
73
-
74
-
75
-
76
-
77
-
78
-
79
-
80
-
81
-
82
-
83
-
84
-
85
-
86
-
87
-
 88
88 -
 89
89 -
 90
90 -
 91
91 -
 92
92 -
 93
93 -
 94
94 -
 95
95 -
 96
96 -
 97
97 -
 98
98 -
 99
99 -
 100
100 -
 101
101 -
 102
102 -
 103
103 -
 104
104 -
 105
105 -
 106
106 -
 107
107 -
 108
108 -
109
-
110
-
111
-
112
-
113
-
114
-
115
-
116
-
117
-
118
-
119
-
120
-
121
-
122
-
123
-
124
-
125
-
126
-
127
-
128
-
129
-
130
-
131
-
132
-
133
-
134
-
135
-
136
-
137
-
138
-
139
-
140
-
141
-
142
-
143
-
144
-
145
-
146
-
147
-
148
-
149
-
150
-
151
-
152
-
153
-
154
-
155
-
156
-
157
-
158
-
159
-
160
-
161
-
162
-
163
-
164
-
165
-
166
-
167
-
168
-
169
-
170
-
171
-
172
-
173
-
174
-
175
-
176
-
177
-
178
 |
 |

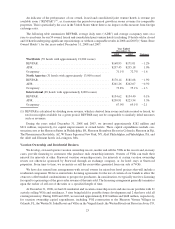
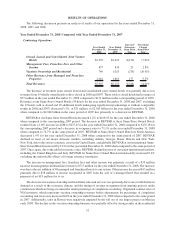
RESULTS OF OPERATIONS
The following discussion presents an analysis of results of our operations for the years ended December 31,
2008, 2007 and 2006.
Year Ended December 31, 2008 Compared with Year Ended December 31, 2007
Continuing Operations
Year Ended
December 31,
2008
Year Ended
December 31,
2007
Increase/
(Decrease)
from Prior
Year
Percentage
Change
from Prior
Year
Owned, Leased and Consolidated Joint Venture
Hotels................................. $2,259 $2,429 $(170) (7.0)%
Management Fees, Franchise Fees and Other
Income ................................ 857 834 23 2.8%
Vacation Ownership and Residential ........... 749 1,025 (276) (26.9)%
Other Revenues from Managed and Franchise
Properties .............................. 2,042 1,865 177 9.5%
Total Revenues ............................ $5,907 $6,153 $(246) (4.0)%
The decrease in revenues from owned, leased and consolidated joint venture hotels was partially due to lost
revenues from 19 wholly owned hotels sold or closed in 2008 and 2007. These sold or closed hotels had revenues of
$77 million in the year ended December 31, 2008 compared to $121 million in the corresponding period of 2007.
Revenues at our Same-Store Owned Hotels (59 hotels for the year ended December 31, 2008 and 2007, excluding
the 19 hotels sold or closed and 10 additional hotels undergoing significant repositionings or without comparable
results in 2008 and 2007) decreased 1.5%, or $31 million, to $2.015 billion for the year ended December 31, 2008
when compared to $2.046 billion in the same period of 2007 due primarily to a decrease in REVPAR.
REVPAR at our Same-Store Owned Hotels decreased 1.2% to $168.93 for the year ended December 31, 2008
when compared to the corresponding 2007 period. The decrease in REVPAR at these Same-Store Owned Hotels
resulted from a 1.0% increase in ADR to $237.45 for the year ended December 31, 2008 compared to $235.18 for
the corresponding 2007 period and a decrease in occupancy rates to 71.1% in the year ended December 31, 2008
when compared to 72.7% in the same period in 2007. REVPAR at Same-Store Owned Hotels in North America
decreased 1.9% for the year ended December 31, 2008 when compared to the same period of 2007. REVPAR
declined in most of our major domestic markets, including Atlanta, Georgia, Kauai, Hawaii and New York,
New York, due to the severe economic crisis in the United States, and globally. REVPAR at our international Same-
Store Owned Hotels increased by 0.1% for the year ended December 31, 2008 when compared to the same period of
2007. Once again, due to the global economic crisis, REVPAR declined in most of our major international markets,
including the United Kingdom and Italy. REVPAR for Same-Store Owned Hotels internationally increased 0.6%
excluding the unfavorable effects of foreign currency translation.
The increase in management fees, franchise fees and other income was primarily a result of a $35 million
increase in management and franchise revenue to $717 million for the year ended December 31, 2008. The increase
was due to the net addition of 48 managed and franchised hotels to our system. Other income decreased $13 million
primarily due to $18 million of income recognized in 2007 from the sale of a managed hotel that resulted in a
payment of an $18 million fee to us.
The decrease in vacation ownership and residential sales and services was primarily due to an overall decline in
demand as a result of the economic climate, and the timing of revenue recognition from ongoing projects under
construction which are being accounted for under percentage of completion accounting. Originated contract sales of
VOI inventory, which represents vacation ownership revenues before adjustments for percentage of completion
accounting and rescission, decreased 26% in the year ended December 31, 2008 when compared to the same period
in 2007. Additionally, sales in Hawaii were negatively impacted by the sell out of our largest project on Maui in
early 2008. The decline in the vacation ownership business was partially offset by strong results in the residential
32