Starwood 2008 Annual Report Download - page 85
Download and view the complete annual report
Please find page 85 of the 2008 Starwood annual report below. You can navigate through the pages in the report by either clicking on the pages listed below, or by using the keyword search tool below to find specific information within the annual report.
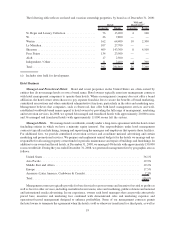
The following table reflects our hotel and vacation ownership properties, by brand as of December 31, 2008:
Properties Rooms Properties Rooms
Hotels
VOI and
Residential
(a)
St. Regis and Luxury Collection .................. 76 13,200 4 100
W......................................... 26 7,800 — —
Westin ..................................... 162 64,400 10 2,300
Le Méridien ................................. 107 27,700 — —
Sheraton .................................... 409 143,300 8 4,500
Four Points .................................. 134 23,500 — —
Aloft. ...................................... 17 2,500 — —
Independent / Other ............................ 11 2,400 4 300
Total ....................................... 942 284,800 26 7,200
(a) Includes sites held for development.
Hotel Business
Managed and Franchised Hotels. Hotel and resort properties in the United States are often owned by
entities that do not manage hotels or own a brand name. Hotel owners typically enter into management contracts
with hotel management companies to operate their hotels. When a management company does not offer a brand
affiliation, the hotel owner often chooses to pay separate franchise fees to secure the benefits of brand marketing,
centralized reservations and other centralized administrative functions, particularly in the sales and marketing area.
Management believes that companies, such as Starwood, that offer both hotel management services and well-
established worldwide brand names appeal to hotel owners by providing the full range of management, marketing
and reservation services. In 2008, we opened 84 managed and franchised hotels with approximately 20,000 rooms
and 36 managed and franchised hotels with approximately 11,000 rooms left the system.
Managed Hotels. We manage hotels worldwide, usually under a long-term agreement with the hotel owner
(including entities in which we have a minority equity interest). Our responsibilities under hotel management
contracts typically include hiring, training and supervising the managers and employees that operate these facilities.
For additional fees, we provide centralized reservation services and coordinate national advertising and certain
marketing and promotional services. We prepare and implement annual budgets for the hotels we manage and are
responsible for allocating property-owner funds for periodic maintenance and repair of buildings and furnishings. In
addition to our owned and leased hotels, at December 31, 2008, we managed 436 hotels with approximately 150,000
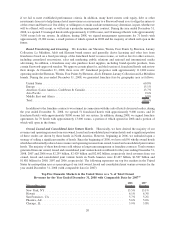
rooms worldwide. During the year ended December 31, 2008, we generated management fees by geographic area as
follows:
United States ............................................................ 36.1%
Asia Pacific ............................................................. 19.9%
Middle East and Africa . ................................................... 19.2%
Europe ................................................................ 17.5%
Americas (Latin America, Caribbean & Canada).................................. 7.3%
Total .................................................................. 100.0%
Management contracts typically provide for base fees tied to gross revenue and incentive fees tied to profits as
well as fees for other services, including centralized reservations, sales and marketing, public relations and national
and international media advertising. In our experience, owners seek hotel managers that can provide attractively
priced base, incentive and marketing fees combined with demonstrated sales and marketing expertise and
operations-focused management designed to enhance profitability. Some of our management contracts permit
the hotel owner to terminate the agreement when the hotel is sold or otherwise transferred to a third party, as well as
19


