Starwood 2008 Annual Report Download - page 86
Download and view the complete annual report
Please find page 86 of the 2008 Starwood annual report below. You can navigate through the pages in the report by either clicking on the pages listed below, or by using the keyword search tool below to find specific information within the annual report.-
 1
1 -
2
-
3
-
4
-
5
-
6
-
7
-
8
-
9
-
10
-
11
-
12
-
13
-
14
-
15
-
16
-
17
-
18
-
19
-
20
-
21
-
22
-
23
-
24
-
25
-
26
-
27
-
28
-
29
-
30
-
31
-
32
-
33
-
34
-
35
-
36
-
37
-
38
-
39
-
40
-
41
-
42
-
43
-
44
-
45
-
46
-
47
-
48
-
49
-
50
-
51
-
52
-
53
-
54
-
55
-
56
-
57
-
58
-
59
-
60
-
61
-
62
-
63
-
64
-
65
-
66
-
67
-
68
-
69
-
70
-
71
-
72
-
73
-
74
-
75
-
 76
76 -
 77
77 -
 78
78 -
 79
79 -
 80
80 -
 81
81 -
 82
82 -
 83
83 -
 84
84 -
 85
85 -
 86
86 -
 87
87 -
 88
88 -
 89
89 -
 90
90 -
 91
91 -
 92
92 -
 93
93 -
 94
94 -
 95
95 -
 96
96 -
97
-
98
-
99
-
100
-
101
-
102
-
103
-
104
-
105
-
106
-
107
-
108
-
109
-
110
-
111
-
112
-
113
-
114
-
115
-
116
-
117
-
118
-
119
-
120
-
121
-
122
-
123
-
124
-
125
-
126
-
127
-
128
-
129
-
130
-
131
-
132
-
133
-
134
-
135
-
136
-
137
-
138
-
139
-
140
-
141
-
142
-
143
-
144
-
145
-
146
-
147
-
148
-
149
-
150
-
151
-
152
-
153
-
154
-
155
-
156
-
157
-
158
-
159
-
160
-
161
-
162
-
163
-
164
-
165
-
166
-
167
-
168
-
169
-
170
-
171
-
172
-
173
-
174
-
175
-
176
-
177
-
178
 |
 |

if we fail to meet established performance criteria. In addition, many hotel owners seek equity, debt or other
investments from us to help finance hotel renovations or conversions to a Starwood brand so as to align the interests
of the owner and Starwood. Our ability or willingness to make such investments may determine, in part, whether we
will be offered, will accept, or will retain a particular management contract. During the year ended December 31,
2008, we opened 33 managed hotels with approximately 11,000 rooms, and 10 managed hotels with approximately
3,000 rooms left our system. In addition, during 2008, we signed management agreements for 71 hotels with
approximately 23,000 rooms, a small portion of which opened in 2008 and the majority of which will open in the
future.
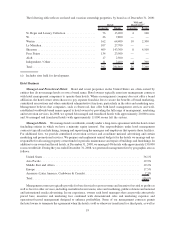
Brand Franchising and Licensing. We franchise our Sheraton, Westin, Four Points by Sheraton, Luxury
Collection, Le Méridien, Aloft and Element brand names and generally derive licensing and other fees from
franchisees based on a fixed percentage of the franchised hotel’s room revenue, as well as fees for other services,
including centralized reservations, sales and marketing, public relations and national and international media
advertising. In addition, a franchisee may also purchase hotel supplies, including brand-specific products, from
certain Starwood-approved vendors. We approve certain plans for, and the location of, franchised hotels and review
their design. At December 31, 2008, there were 437 franchised properties with approximately 111,000 rooms
operating under the Sheraton, Westin, Four Points by Sheraton, Aloft, Element, Luxury Collection and Le Méridien
brands. During the year ended December 31, 2008, we generated franchise fees by geographic area as follows:
United States ............................................................ 60.8%
Europe ................................................................ 15.1%
Americas (Latin America, Caribbean & Canada).................................. 13.7%
Asia Pacific ............................................................. 9.6%
Middle East and Africa . ................................................... 0.8%
Total .................................................................. 100.0%
In addition to the franchise contracts we retained in connection with the sale of hotels discussed earlier, during
the year ended December 31, 2008, we opened 51 franchised hotels with approximately 9,000 rooms, and 26
franchised hotels with approximately 8,000 rooms left our system. In addition, during 2008, we signed franchise
agreements for 76 hotels with approximately 13,000 rooms, a portion of which opened in 2008 and a portion of
which will open in the future.
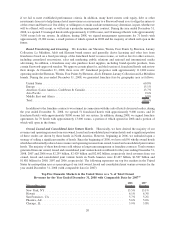
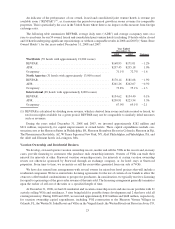
Owned, Leased and Consolidated Joint Venture Hotels. Historically, we have derived the majority of our
revenues and operating income from our owned, leased and consolidated joint venture hotels and a significant portion
of these results are driven by these hotels in North America. However, beginning in 2006, we embarked upon a
strategy of selling a significant number of hotels. Since the beginning of 2006, we have sold 56 wholly owned hotels
which has substantially reduced our revenues and operating income from owned, leased and consolidated joint venture
hotels. The majority of these hotels were sold subject to long-term management or franchise contracts. Total revenues
generated from our owned, leased and consolidated joint venture hotels worldwide for the years ending December 31,
2008, 2007 and 2006 were $2.259 billion, $2.429 billion and $2.692 billion, respectively (total revenues from our
owned, leased and consolidated joint venture hotels in North America were $1.427 billion, $1.587 billion and
$1.881 billion for 2008, 2007 and 2006, respectively). The following represents our top five markets in the United
States by metropolitan area as a percentage of our total owned, leased and consolidated joint venture revenues for the
year ended December 31, 2008 (with comparable data for 2007):
Top Five Domestic Markets in the United States as a % of Total Owned
Revenues for the Year Ended December 31, 2008 with Comparable Data for 2007
(1)
Metropolitan Area
2008
Revenues
2007
Revenues
New York, NY ................................................ 13.5% 13.1%
Hawaii ...................................................... 6.1% 6.3%
San Francisco, CA ............................................. 5.7% 5.2%
Phoenix, AZ .................................................. 5.6% 5.6%
Chicago, IL .................................................. 3.9% 3.8%
20