Starwood 2008 Annual Report Download - page 157
Download and view the complete annual report
Please find page 157 of the 2008 Starwood annual report below. You can navigate through the pages in the report by either clicking on the pages listed below, or by using the keyword search tool below to find specific information within the annual report.-
 1
1 -
2
-
3
-
4
-
5
-
6
-
7
-
8
-
9
-
10
-
11
-
12
-
13
-
14
-
15
-
16
-
17
-
18
-
19
-
20
-
21
-
22
-
23
-
24
-
25
-
26
-
27
-
28
-
29
-
30
-
31
-
32
-
33
-
34
-
35
-
36
-
37
-
38
-
39
-
40
-
41
-
42
-
43
-
44
-
45
-
46
-
47
-
48
-
49
-
50
-
51
-
52
-
53
-
54
-
55
-
56
-
57
-
58
-
59
-
60
-
61
-
62
-
63
-
64
-
65
-
66
-
67
-
68
-
69
-
70
-
71
-
72
-
73
-
74
-
75
-
76
-
77
-
78
-
79
-
80
-
81
-
82
-
83
-
84
-
85
-
86
-
87
-
88
-
89
-
90
-
91
-
92
-
93
-
94
-
95
-
96
-
97
-
98
-
99
-
100
-
101
-
102
-
103
-
104
-
105
-
106
-
107
-
108
-
109
-
110
-
111
-
112
-
113
-
114
-
115
-
116
-
117
-
118
-
119
-
120
-
121
-
122
-
123
-
124
-
125
-
126
-
127
-
128
-
129
-
130
-
131
-
132
-
133
-
134
-
135
-
136
-
137
-
138
-
139
-
140
-
141
-
142
-
143
-
144
-
145
-
146
-
 147
147 -
 148
148 -
 149
149 -
 150
150 -
 151
151 -
 152
152 -
 153
153 -
 154
154 -
 155
155 -
 156
156 -
 157
157 -
 158
158 -
 159
159 -
 160
160 -
 161
161 -
 162
162 -
 163
163 -
 164
164 -
 165
165 -
 166
166 -
 167
167 -
168
-
169
-
170
-
171
-
172
-
173
-
174
-
175
-
176
-
177
-
178
 |
 |

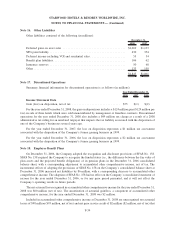
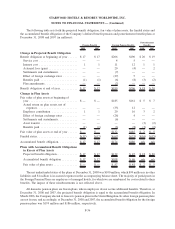
As previously discussed, the Company utilizes the Lattice model to calculate the fair value of option grants.
Weighted average assumptions used to determine the fair value of option grants were as follows:
2008 2007 2006
Year Ended December 31,
Dividend yield ....................................... 1.50% 1.40% 1.41%
Volatility:
Near term ........................................ 38% 25% 26%
Long term ........................................ 36% 37% 40%
Expected life ........................................ 6yrs 6yrs 6yrs
Yield curve:
6 month .......................................... 1.90% 5.12% 4.68%
1 year ........................................... 1.91% 4.96% 4.66%
3 year ........................................... 2.17% 4.55% 4.58%
5 year ........................................... 2.79% 4.52% 4.53%
10 year .......................................... 3.73% 4.56% 4.58%
The dividend yield is estimated based on the current annualized dividend payment and the average price of the
Shares or Corporation Shares, as the case may be, during the prior year.
The estimated volatility is based on a combination of historical share price volatility as well as implied
volatility based on market analysis. The historical share price volatility was measured over an 8-year period, which
is equal to the contractual term of the options. The weighted average volatility for 2008 grants was 37%.
The expected life represents the period that the Company’s stock-based awards are expected to be outstanding.
It was determined based on an actuarial calculation which was based on historical experience, giving consideration
to the contractual terms of the stock-based awards and vesting schedules.
The yield curve (risk-free interest rate) is based on the implied zero-coupon yield from the U.S. Treasury yield
curve over the expected term of the option.
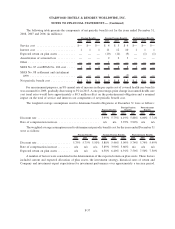
The following table summarizes stock option activity for the Company:
Options
(In millions)
Weighted Average
Exercise
Price Per Share
Outstanding at December 31, 2007 .......................... 12.8 $36.60
Granted ............................................ 0.7 49.52
Exercised ........................................... (4.1) 28.55
Forfeited, Canceled or Expired ........................... (0.7) 47.90
Outstanding at December 31, 2008 .......................... 8.7 $40.66
Exercisable at December 31, 2008 .......................... 6.5 $37.31
The weighted-average fair value per option for options granted during 2008, 2007 and 2006 was $17.24,
$20.54 and $16.12, respectively, and the service period is typically four years. The total intrinsic value of options
exercised during 2008, 2007 and 2006 was approximately $89 million, $187 million and $370 million, respectively,
resulting in tax benefits of approximately $35 million, $56 million and $128 million, respectively. As of
December 31, 2008, there was approximately $17 million of unrecognized compensation cost, net of estimated
forfeitures, related to nonvested options, which is expected to be recognized over a weighted-average period of
1.58 years on a straight-line basis for 2007 and future grants and using an accelerated recognition method for grants
prior to January 1, 2006.
F-41
STARWOOD HOTELS & RESORTS WORLDWIDE, INC.
NOTES TO FINANCIAL STATEMENTS — (Continued)