Starwood 2008 Annual Report Download - page 141
Download and view the complete annual report
Please find page 141 of the 2008 Starwood annual report below. You can navigate through the pages in the report by either clicking on the pages listed below, or by using the keyword search tool below to find specific information within the annual report.-
 1
1 -
2
-
3
-
4
-
5
-
6
-
7
-
8
-
9
-
10
-
11
-
12
-
13
-
14
-
15
-
16
-
17
-
18
-
19
-
20
-
21
-
22
-
23
-
24
-
25
-
26
-
27
-
28
-
29
-
30
-
31
-
32
-
33
-
34
-
35
-
36
-
37
-
38
-
39
-
40
-
41
-
42
-
43
-
44
-
45
-
46
-
47
-
48
-
49
-
50
-
51
-
52
-
53
-
54
-
55
-
56
-
57
-
58
-
59
-
60
-
61
-
62
-
63
-
64
-
65
-
66
-
67
-
68
-
69
-
70
-
71
-
72
-
73
-
74
-
75
-
76
-
77
-
78
-
79
-
80
-
81
-
82
-
83
-
84
-
85
-
86
-
87
-
88
-
89
-
90
-
91
-
92
-
93
-
94
-
95
-
96
-
97
-
98
-
99
-
100
-
101
-
102
-
103
-
104
-
105
-
106
-
107
-
108
-
109
-
110
-
111
-
112
-
113
-
114
-
115
-
116
-
117
-
118
-
119
-
120
-
121
-
122
-
123
-
124
-
125
-
126
-
127
-
128
-
129
-
130
-
 131
131 -
 132
132 -
 133
133 -
 134
134 -
 135
135 -
 136
136 -
 137
137 -
 138
138 -
 139
139 -
 140
140 -
 141
141 -
 142
142 -
 143
143 -
 144
144 -
 145
145 -
 146
146 -
 147
147 -
 148
148 -
 149
149 -
 150
150 -
 151
151 -
152
-
153
-
154
-
155
-
156
-
157
-
158
-
159
-
160
-
161
-
162
-
163
-
164
-
165
-
166
-
167
-
168
-
169
-
170
-
171
-
172
-
173
-
174
-
175
-
176
-
177
-
178
 |
 |

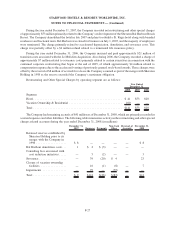
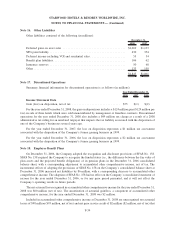
The Company completed a sensitivity analysis on the net present value of the Retained Interests to measure the
change in value associated with independent changes in individual key variables. The methodology applied
unfavorable changes for the key variables of expected prepayment rates, discount rates and expected gross credit
losses as of December 31, 2008. The decreases in value of the Retained Interests that would result from various
independent changes in key variables are shown in the chart that follows (in millions). The factors may not move
independently of each other.
Annual prepayment rate:
100 basis points-dollars .................................................. $ 0.4
100 basis points-percentage ............................................... 2.4%
200 basis points-dollars .................................................. $ 0.8
200 basis points-percentage ............................................... 4.6%
Discount rate:
100 basis points-dollars .................................................. $ 0.3
100 basis points-percentage ............................................... 1.9%
200 basis points-dollars .................................................. $ 0.7
200 basis points-percentage ............................................... 3.7%
Gross annual rate of credit losses:
100 basis points-dollars .................................................. $ 4.9
100 basis points-percentage ............................................... 27.4%
200 basis points-dollars .................................................. $ 8.8
200 basis points-percentage ............................................... 49.0%
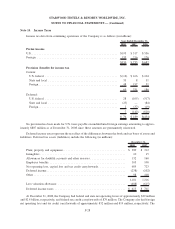
Note 11. Fair Value
In accordance with SFAS No. 157, the following table presents the Company’s fair value hierarchy for its
financial assets and liabilities measured at fair value on a recurring basis as of December 31, 2008 (in millions):
Level 1 Level 2 Level 3 Total
Assets:
Forward contracts.................................. $— $ 6 $— $ 6
Retained Interests.................................. — — 19 19
$— $ 6 $19 $25
Liabilities:
Forward contracts.................................. $— $ 3 $— $ 3
The forward contracts are over the counter contracts that do not trade on a public exchange. The fair values of
the contracts are based on inputs such as foreign currency spot rates and forward points that are readily available on
public markets, and as such, are classified as Level 2. The Company considered both its credit risk, as well as its
counterparties’ credit risk in determining fair value and no adjustment was made as it was deemed insignificant
based on the short duration of the contracts and the Company’s rate of short-term debt.
F-25
STARWOOD HOTELS & RESORTS WORLDWIDE, INC.
NOTES TO FINANCIAL STATEMENTS — (Continued)