Starwood 2008 Annual Report Download - page 100
Download and view the complete annual report
Please find page 100 of the 2008 Starwood annual report below. You can navigate through the pages in the report by either clicking on the pages listed below, or by using the keyword search tool below to find specific information within the annual report.-
 1
1 -
2
-
3
-
4
-
5
-
6
-
7
-
8
-
9
-
10
-
11
-
12
-
13
-
14
-
15
-
16
-
17
-
18
-
19
-
20
-
21
-
22
-
23
-
24
-
25
-
26
-
27
-
28
-
29
-
30
-
31
-
32
-
33
-
34
-
35
-
36
-
37
-
38
-
39
-
40
-
41
-
42
-
43
-
44
-
45
-
46
-
47
-
48
-
49
-
50
-
51
-
52
-
53
-
54
-
55
-
56
-
57
-
58
-
59
-
60
-
61
-
62
-
63
-
64
-
65
-
66
-
67
-
68
-
69
-
70
-
71
-
72
-
73
-
74
-
75
-
76
-
77
-
78
-
79
-
80
-
81
-
82
-
83
-
84
-
85
-
86
-
87
-
88
-
89
-
 90
90 -
 91
91 -
 92
92 -
 93
93 -
 94
94 -
 95
95 -
 96
96 -
 97
97 -
 98
98 -
 99
99 -
 100
100 -
 101
101 -
 102
102 -
 103
103 -
 104
104 -
 105
105 -
 106
106 -
 107
107 -
 108
108 -
 109
109 -
 110
110 -
111
-
112
-
113
-
114
-
115
-
116
-
117
-
118
-
119
-
120
-
121
-
122
-
123
-
124
-
125
-
126
-
127
-
128
-
129
-
130
-
131
-
132
-
133
-
134
-
135
-
136
-
137
-
138
-
139
-
140
-
141
-
142
-
143
-
144
-
145
-
146
-
147
-
148
-
149
-
150
-
151
-
152
-
153
-
154
-
155
-
156
-
157
-
158
-
159
-
160
-
161
-
162
-
163
-
164
-
165
-
166
-
167
-
168
-
169
-
170
-
171
-
172
-
173
-
174
-
175
-
176
-
177
-
178
 |
 |

Year Ended
December 31,
2008
Year Ended
December 31,
2007
Increase/
(Decrease)
from Prior
Year
Percentage
Change
from Prior
Year
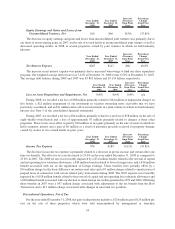
Equity Earnings and Gains and Losses from
Unconsolidated Ventures, Net .......... $16 $66 $(50) (75.8)%
The decrease in equity earnings and gains and losses from unconsolidated joint ventures was primarily due to
our share of non-recurring gains, in 2007, on the sale of several hotels in an unconsolidated joint venture as well as
decreased operating results, in 2008, at several properties owned by joint ventures in which we hold minority
interests.
Year Ended
December 31,
2008
Year Ended
December 31,
2007
Increase/
(Decrease)
from Prior
Year
Percentage
Change
from Prior
Year
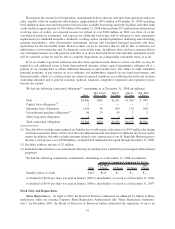
Net Interest Expense ................... $207 $147 $60 40.8%
The increase in net interest expense was primarily due to increased borrowings to fund our share repurchase
program. Our weighted average interest rate was 5.24% at December 31, 2008 versus 6.52% at December 31, 2007.
The average debt balance during 2008 and 2007 was $3.802 billion and $3.114 billion respectively.
Year Ended
December 31,
2008
Year Ended
December 31,
2007
Increase/
(Decrease)
from Prior
Year
Percentage
Change
from Prior
Year
Loss on Asset Dispositions and Impairments, Net . . $(98) $(44) $(54) n/a
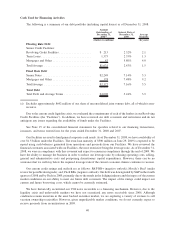
During 2008, we recorded a net loss of $98 million primarily related to $64 million of impairment charges on
five hotels, a $22 million impairment of our investment in vacation ownership notes receivable that we have
previously securitized, and an $11 million write-off of our investment in a joint venture in which we hold minority
interest (see Note 5 of the consolidated financial statements).
During 2007, we recorded a net loss of $44 million primarily related to a net loss of $58 million on the sale of
eight wholly-owned hotels and a loss of approximately $7 million primarily related to charges at three other
properties. These losses were offset in part by $20 million of net gains primarily on the sale of assets in which we
held a minority interest and a gain of $6 million as a result of insurance proceeds received for property damage
caused by storms at two owned hotels in prior years.
Year Ended
December 31,
2008
Year Ended
December 31,
2007
Increase/
(Decrease)
from Prior
Year
Percentage
Change
from Prior
Year
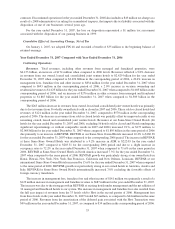
Income Tax Expense ................... $76 $189 $(113) (59.8)%
The decrease in income tax expense is primarily related to a decrease in pretax income and certain other one
time tax benefits. The effective tax rate decreased to 23.0% in the year ended December 31, 2008 as compared to
25.8% in 2007. The 2008 tax rate was favorably impacted by a $31 million benefit related to the reversal of capital
and net operating loss valuation allowances, a $20 million benefit related to lower foreign taxes, and a $14 million
benefit associated with tax on the repatriation of foreign earnings. These benefits were partially offset by a
$16 million charge for the basis difference on certain asset sales and a $7 million charge related to amortization of
prepaid taxes in connection with certain related party transactions during 2008. The 2007 expense was favorably
impacted by a $158 million benefit related to the reversal of capital and net operating loss valuation allowances and
a $28 million benefit associated with our election to claim foreign tax credits generated in 1999 and 2000. Offsetting
these benefits in 2007 were a $97 million charge associated with adjustments to the tax benefit from the Host
Transaction and a $13 million charge associated with changes in uncertain tax positions.
Discontinued Operations, Net of Tax
For the year ended December 31, 2008, the gain on dispositions includes a $124 million gain ($129 million pre
tax) on the sale of three properties which were sold unencumbered by management or franchise
34