Starwood 2008 Annual Report Download - page 41
Download and view the complete annual report
Please find page 41 of the 2008 Starwood annual report below. You can navigate through the pages in the report by either clicking on the pages listed below, or by using the keyword search tool below to find specific information within the annual report.-
 1
1 -
2
-
3
-
4
-
5
-
6
-
7
-
8
-
9
-
10
-
11
-
12
-
13
-
14
-
15
-
16
-
17
-
18
-
19
-
20
-
21
-
22
-
23
-
24
-
25
-
26
-
27
-
28
-
29
-
30
-
 31
31 -
 32
32 -
 33
33 -
 34
34 -
 35
35 -
 36
36 -
 37
37 -
 38
38 -
 39
39 -
 40
40 -
 41
41 -
 42
42 -
 43
43 -
 44
44 -
 45
45 -
 46
46 -
 47
47 -
 48
48 -
 49
49 -
 50
50 -
 51
51 -
52
-
53
-
54
-
55
-
56
-
57
-
58
-
59
-
60
-
61
-
62
-
63
-
64
-
65
-
66
-
67
-
68
-
69
-
70
-
71
-
72
-
73
-
74
-
75
-
76
-
77
-
78
-
79
-
80
-
81
-
82
-
83
-
84
-
85
-
86
-
87
-
88
-
89
-
90
-
91
-
92
-
93
-
94
-
95
-
96
-
97
-
98
-
99
-
100
-
101
-
102
-
103
-
104
-
105
-
106
-
107
-
108
-
109
-
110
-
111
-
112
-
113
-
114
-
115
-
116
-
117
-
118
-
119
-
120
-
121
-
122
-
123
-
124
-
125
-
126
-
127
-
128
-
129
-
130
-
131
-
132
-
133
-
134
-
135
-
136
-
137
-
138
-
139
-
140
-
141
-
142
-
143
-
144
-
145
-
146
-
147
-
148
-
149
-
150
-
151
-
152
-
153
-
154
-
155
-
156
-
157
-
158
-
159
-
160
-
161
-
162
-
163
-
164
-
165
-
166
-
167
-
168
-
169
-
170
-
171
-
172
-
173
-
174
-
175
-
176
-
177
-
178
 |
 |

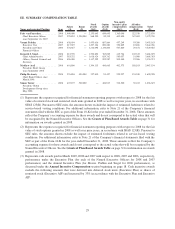
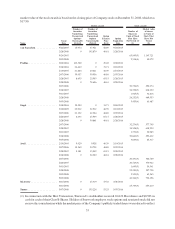
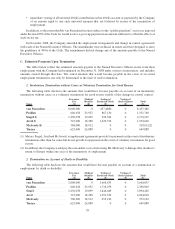
III. SUMMARY COMPENSATION TABLE
Name and principal Position Year
Salary
($)
Bonus
($)
Stock
awards
($)(1)
Option
awards
($)(2)
Non-equity
incentive plan
compensation
($)(3)
All other
compensation
($)(4)
Total
($)
Frits van Paasschen,.......... 2008 1,000,000 — 2,135,643 699,695 1,365,000 522,538 5,722,876
Chief Executive Officer 2007 270,833 1,500,000 568,350 89,315 403,800 347,402 3,179,700
since September 24, 2007
Vasant Prabhu, ............. 2008 638,054 — 1,435,616 887,864 437,249 93,380 3,492,163
Executive Vice 2007 617,927 — 1,497,164 890,260 550,809 85,896 3,642,056
President and Chief 2006 578,667 — 1,216,698 1,136,806 567,840 29,674 3,529,685
Financial Officer
Kenneth S. Siegel,............ 2008 612,539 — 1,590,852 763,025 419,764 102,515 3,488,695
Chief Administrative 2007 583,232 — 1,618,424 829,762 585,037 51,908 3,668,363
Officer, General Counsel and
Secretary
2006 496,000 — 1,117,399 992,287 505,440 23,586 3,134,712
Matthew Avril .............. 2008 601,896 — 1,394,115 480,665 402,375 188,103 3,067,154
President, Hotel Group
since September 2008
Philip McAveety ............. 2008 376,894 494,000 337,810 91,427 255,937 134,530 1,690,598
Chief Brand Officer since
March 2008
Simon Turner .............. 2008 407,197 500,000 — 406,913 312,500 30,013 1,656,623
President, Global
Development Group since
May 2008
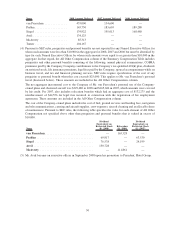
(1) Represents the expense recognized for financial statement reporting purposes with respect to 2008 for the fair
value of restricted stock and restricted stock units granted in 2008 as well as in prior years, in accordance with
SFAS 123(R). Pursuant to SEC rules, the amounts shown exclude the impact of estimated forfeitures related to
service-based vesting conditions. For additional information, refer to Note 21 of the Company’s financial
statements filed with the SEC as part of the Form 10-K for the year ended December 31, 2008. These amounts
reflect the Company’s accounting expense for these awards and do not correspond to the actual value that will
be recognized by the Named Executive Officers. See the Grants of Plan-Based Awards Table on page 31 for
information on awards granted in 2008.
(2) Represents the expense recognized for financial statement reporting purposes with respect to 2008 for the fair
value of stock options granted in 2008 as well as in prior years, in accordance with SFAS 123(R). Pursuant to
SEC rules, the amounts shown exclude the impact of estimated forfeitures related to service-based vesting
conditions. For additional information, refer to Note 21 of the Company’s financial statements filed with the
SEC as part of the Form 10-K for the year ended December 31, 2008. These amounts reflect the Company’s
accounting expense for these awards and do not correspond to the actual value that will be recognized by the
Named Executive Officers. See the Grants of Plan-Based Awards Table on page 31 for information on awards
granted in 2008.
(3) Represents cash awards paid in March 2009, 2008 and 2007 with respect to 2008, 2007 and 2006, respectively,
performance under the Executive Plan (for each of the Named Executive Officers for 2008 and 2007
performance) and the Annual Incentive Plan (for Messrs. Prabhu and Siegel for 2006 performance), as
discussed under the Annual Incentive Compensation section beginning on page 18. Cash incentive awards
exclude the following amounts that were deferred into deferred stock units (Executive Plan) or shares of
restricted stock (Executive AIP) and increased by 33% in accordance with the Executive Plan and Executive
AIP:
29