Starwood 2008 Annual Report Download - page 104
Download and view the complete annual report
Please find page 104 of the 2008 Starwood annual report below. You can navigate through the pages in the report by either clicking on the pages listed below, or by using the keyword search tool below to find specific information within the annual report.-
 1
1 -
2
-
3
-
4
-
5
-
6
-
7
-
8
-
9
-
10
-
11
-
12
-
13
-
14
-
15
-
16
-
17
-
18
-
19
-
20
-
21
-
22
-
23
-
24
-
25
-
26
-
27
-
28
-
29
-
30
-
31
-
32
-
33
-
34
-
35
-
36
-
37
-
38
-
39
-
40
-
41
-
42
-
43
-
44
-
45
-
46
-
47
-
48
-
49
-
50
-
51
-
52
-
53
-
54
-
55
-
56
-
57
-
58
-
59
-
60
-
61
-
62
-
63
-
64
-
65
-
66
-
67
-
68
-
69
-
70
-
71
-
72
-
73
-
74
-
75
-
76
-
77
-
78
-
79
-
80
-
81
-
82
-
83
-
84
-
85
-
86
-
87
-
88
-
89
-
90
-
91
-
92
-
93
-
 94
94 -
 95
95 -
 96
96 -
 97
97 -
 98
98 -
 99
99 -
 100
100 -
 101
101 -
 102
102 -
 103
103 -
 104
104 -
 105
105 -
 106
106 -
 107
107 -
 108
108 -
 109
109 -
 110
110 -
 111
111 -
 112
112 -
 113
113 -
 114
114 -
115
-
116
-
117
-
118
-
119
-
120
-
121
-
122
-
123
-
124
-
125
-
126
-
127
-
128
-
129
-
130
-
131
-
132
-
133
-
134
-
135
-
136
-
137
-
138
-
139
-
140
-
141
-
142
-
143
-
144
-
145
-
146
-
147
-
148
-
149
-
150
-
151
-
152
-
153
-
154
-
155
-
156
-
157
-
158
-
159
-
160
-
161
-
162
-
163
-
164
-
165
-
166
-
167
-
168
-
169
-
170
-
171
-
172
-
173
-
174
-
175
-
176
-
177
-
178
 |
 |

On January 1, 2006, we adopted SFAS No. 152 and recorded a charge of $70 million, net of a $46 million tax
benefit, in cumulative effect of accounting change.
LIQUIDITY AND CAPITAL RESOURCES
Cash From Operating Activities
Cash flow from operating activities is generated primarily from management and franchise revenues,
operating income from our owned hotels and sales of VOIs and residential units. Other sources of cash are
distributions from joint-ventures, servicing financial assets and interest income. These are the principal sources of
cash used to fund our operating expenses, interest payments on debt, capital expenditures, dividend payments,
property and income taxes and share repurchases. We believe that our existing borrowing availability together with
capacity for additional borrowings and cash from operations will be adequate to meet all funding requirements for
our operating expenses, principal and interest payments on debt, capital expenditures, dividend payments and share
repurchases in the foreseeable future.
The majority of our cash flow is derived from corporate and leisure travelers and is dependent on the supply
and demand in the lodging industry. In a recessionary economy, we experience significant declines in business and
leisure travel. The impact of declining demand in the industry and higher hotel supply in key markets could have a
material impact on our sources of cash.
Our day-to-day operations are financed through a net working capital deficit, a practice that is common in our
industry. The ratio of our current assets to current liabilities was 0.81 and 0.87 as of December 31, 2008 and 2007,
respectively. Consistent with industry practice, we sweep the majority of the cash at our owned hotels on a daily
basis and fund payables as needed by drawing down on our existing revolving credit facility.
State and local regulations governing sales of VOIs and residential properties allow the purchaser of such a
VOI or property to rescind the sale subsequent to its completion for a pre-specified number of days. In addition, cash
payments received from buyers of units under construction are held in escrow during the period prior to obtaining a
certificate of occupancy. These payments and the deposits collected from sales during the rescission period are the
primary components of our restricted cash balances in our consolidated balance sheets. At December 31, 2008 and
2007, we had short-term restricted cash balances of $96 million and $196 million, respectively.
Cash From Investing Activities
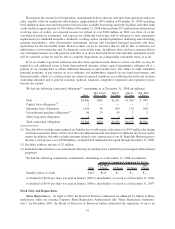
Gross capital spending during the full year ended December 31, 2008 was as follows (in millions):
Capital Expenditures:
Owned, Leased and Consolidated Joint Venture Hotels ......................... $279
Corporate and information technology ..................................... 84
Subtotal ............................................................. 363
Vacation Ownership and Residential Capital Expenditures:
Capital expenditures (includes land acquisitions) ............................. 110
Net capital expenditures for inventory (excluding St. Regis Bal Harbour)
(1)
.......... 131
Capital expenditures for inventory — St. Regis Bal Harbour ..................... 148
Subtotal ............................................................. 389
Development Capital
(2)
................................................. 65
Total Capital Expenditures .............................................. $817
(1) Represents gross inventory capital expenditures of $254 less cost of sales of $123.
(2) Includes $3 million of expenditures that are classified as Plant, property and equipment, net on the consolidated
balance sheet.
38