Starwood 2008 Annual Report Download - page 89
Download and view the complete annual report
Please find page 89 of the 2008 Starwood annual report below. You can navigate through the pages in the report by either clicking on the pages listed below, or by using the keyword search tool below to find specific information within the annual report.-
 1
1 -
2
-
3
-
4
-
5
-
6
-
7
-
8
-
9
-
10
-
11
-
12
-
13
-
14
-
15
-
16
-
17
-
18
-
19
-
20
-
21
-
22
-
23
-
24
-
25
-
26
-
27
-
28
-
29
-
30
-
31
-
32
-
33
-
34
-
35
-
36
-
37
-
38
-
39
-
40
-
41
-
42
-
43
-
44
-
45
-
46
-
47
-
48
-
49
-
50
-
51
-
52
-
53
-
54
-
55
-
56
-
57
-
58
-
59
-
60
-
61
-
62
-
63
-
64
-
65
-
66
-
67
-
68
-
69
-
70
-
71
-
72
-
73
-
74
-
75
-
76
-
77
-
78
-
 79
79 -
 80
80 -
 81
81 -
 82
82 -
 83
83 -
 84
84 -
 85
85 -
 86
86 -
 87
87 -
 88
88 -
 89
89 -
 90
90 -
 91
91 -
 92
92 -
 93
93 -
 94
94 -
 95
95 -
 96
96 -
 97
97 -
 98
98 -
 99
99 -
100
-
101
-
102
-
103
-
104
-
105
-
106
-
107
-
108
-
109
-
110
-
111
-
112
-
113
-
114
-
115
-
116
-
117
-
118
-
119
-
120
-
121
-
122
-
123
-
124
-
125
-
126
-
127
-
128
-
129
-
130
-
131
-
132
-
133
-
134
-
135
-
136
-
137
-
138
-
139
-
140
-
141
-
142
-
143
-
144
-
145
-
146
-
147
-
148
-
149
-
150
-
151
-
152
-
153
-
154
-
155
-
156
-
157
-
158
-
159
-
160
-
161
-
162
-
163
-
164
-
165
-
166
-
167
-
168
-
169
-
170
-
171
-
172
-
173
-
174
-
175
-
176
-
177
-
178
 |
 |

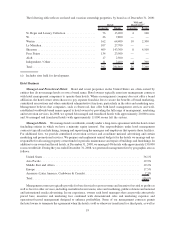
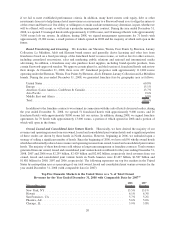
An indicator of the performance of our owned, leased and consolidated joint venture hotels is revenue per
available room (“REVPAR”)
(1)
, as it measures the period-over-period growth in rooms revenue for comparable
properties. This is particularly the case in the United States where there is no impact on this measure from foreign
exchange rates.
The following table summarizes REVPAR, average daily rates (“ADR”) and average occupancy rates on a
year-to-year basis for our 59 owned, leased and consolidated joint venture hotels (excluding 19 hotels sold or closed
and 10 hotels undergoing significant repositionings or without comparable results in 2008 and 2007) (“Same-Store
Owned Hotels”) for the years ended December 31, 2008 and 2007:
2008 2007 Variance
Year Ended
December 31,
Worldwide (59 hotels with approximately 21,000 rooms)
REVPAR ............................................ $168.93 $171.01 ⫺1.2%
ADR............................................... $237.45 $235.18 1.0%
Occupancy ........................................... 71.1% 72.7% ⫺1.6
North America (31 hotels with approximately 13,000 rooms)
REVPAR ............................................ $178.14 $181.68 ⫺1.9%
ADR............................................... $241.26 $242.07 ⫺0.3%
Occupancy ........................................... 73.8% 75.1% ⫺1.3
International (28 hotels with approximately 8,000 rooms)
REVPAR ............................................ $154.62 $154.40 0.1%
ADR............................................... $230.91 $223.54 3.3%
Occupancy ........................................... 67.0% 69.1% ⫺2.1
(1) REVPAR is calculated by dividing room revenue, which is derived from rooms and suites rented or leased, by
total room nights available for a given period. REVPAR may not be comparable to similarly titled measures
such as revenues.
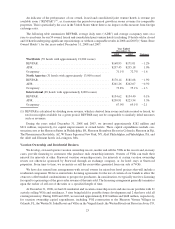
During the years ended December 31, 2008 and 2007, we invested approximately $282 million and
$211 million, respectively, for capital improvements at owned hotels. These capital expenditures include con-
struction costs at the Sheraton Suites in Philadelphia, PA, Sheraton Steamboat Resort in Colorado, Sheraton in Fiji,
The Phoenician in Scottsdale, AZ, W Times Square in New York, NY, Aloft Philadelphia, in Philadelphia, PA, and
the Aloft and Element hotels in Lexington, MA.
Vacation Ownership and Residential Business
We develop, own and operate vacation ownership resorts, market and sell the VOIs in the resorts and, in many
cases, provide financing to customers who purchase such ownership interests. Owners of VOIs can trade their
interval for intervals at other Starwood vacation ownership resorts, for intervals at certain vacation ownership
resorts not otherwise sponsored by Starwood through an exchange company, or for hotel stays at Starwood
properties. From time to time, we securitize or sell the receivables generated from our sale of VOIs.
We have also entered into arrangements with several owners for mixed use hotel projects that will include a
residential component. We have entered into licensing agreements for the use of certain of our brands to allow the
owners to offer branded condominiums to prospective purchasers. In consideration, we typically receive a licensing
fee equal to a percentage of the gross sales revenue of the units sold. The licensing arrangement generally terminates
upon the earlier of sell-out of the units or a specified length of time.
At December 31, 2008, we had 26 residential and vacation ownership resorts and sites in our portfolio with 21
actively selling VOIs and residences, 3 sites being held for possible future development and 2 that have sold all
existing inventory. During 2008 and 2007, we invested approximately $363 million and $448 million, respectively,
for vacation ownership capital expenditures, including VOI construction at the Sheraton Vistana Villages in
Orlando, FL, the Westin St. John Resort and Villas in the Virgin Islands, the Westin Riverfront Resort in Avon, CO,
23