Starwood 2008 Annual Report Download - page 70
Download and view the complete annual report
Please find page 70 of the 2008 Starwood annual report below. You can navigate through the pages in the report by either clicking on the pages listed below, or by using the keyword search tool below to find specific information within the annual report.-
 1
1 -
2
-
3
-
4
-
5
-
6
-
7
-
8
-
9
-
10
-
11
-
12
-
13
-
14
-
15
-
16
-
17
-
18
-
19
-
20
-
21
-
22
-
23
-
24
-
25
-
26
-
27
-
28
-
29
-
30
-
31
-
32
-
33
-
34
-
35
-
36
-
37
-
38
-
39
-
40
-
41
-
42
-
43
-
44
-
45
-
46
-
47
-
48
-
49
-
50
-
51
-
52
-
53
-
54
-
55
-
56
-
57
-
58
-
59
-
 60
60 -
 61
61 -
 62
62 -
 63
63 -
 64
64 -
 65
65 -
 66
66 -
 67
67 -
 68
68 -
 69
69 -
 70
70 -
 71
71 -
 72
72 -
 73
73 -
 74
74 -
 75
75 -
 76
76 -
 77
77 -
 78
78 -
 79
79 -
 80
80 -
81
-
82
-
83
-
84
-
85
-
86
-
87
-
88
-
89
-
90
-
91
-
92
-
93
-
94
-
95
-
96
-
97
-
98
-
99
-
100
-
101
-
102
-
103
-
104
-
105
-
106
-
107
-
108
-
109
-
110
-
111
-
112
-
113
-
114
-
115
-
116
-
117
-
118
-
119
-
120
-
121
-
122
-
123
-
124
-
125
-
126
-
127
-
128
-
129
-
130
-
131
-
132
-
133
-
134
-
135
-
136
-
137
-
138
-
139
-
140
-
141
-
142
-
143
-
144
-
145
-
146
-
147
-
148
-
149
-
150
-
151
-
152
-
153
-
154
-
155
-
156
-
157
-
158
-
159
-
160
-
161
-
162
-
163
-
164
-
165
-
166
-
167
-
168
-
169
-
170
-
171
-
172
-
173
-
174
-
175
-
176
-
177
-
178
 |
 |

recognized as the best of the best by readers of Condé Nast Traveler, who are among the world’s most sophisticated
and discerning group of travelers.
Scale. As one of the largest hotel and leisure companies focusing on the luxury and upscale full-service
lodging market, we have the scale to support our core marketing and reservation functions. We also believe that our
scale will contribute to lower our cost of operations through purchasing economies in areas such as insurance,
energy, telecommunications, technology, employee benefits, food and beverage, furniture, fixtures and equipment
and operating supplies. We feel we are well-positioned for further significant growth based on the number of hotels
and rooms in our system. We currently have approximately half of the base of rooms compared to our major
competitors, and as a result, as we increase our room count, our economies of scale should provide a favorable
impact to our operations given our existing cost structure.
Diversification of Cash Flow and Assets. Management believes that the diversity of our brands, market
segments served, revenue sources and geographic locations provide a broad base from which to enhance revenue
and profits and to strengthen our global brands. This diversity limits our exposure to any particular lodging or
vacation ownership asset, brand or geographic region.
While we focus on the luxury and upscale portion of the full-service lodging, vacation ownership and
residential markets, our brands cater to a diverse group of sub-markets within this market. For example, the St.
Regis hotels cater to high-end hotel and resort clientele while Four Points by Sheraton hotels deliver extensive
amenities and services at more affordable rates. The Aloft brand will provide a youthful alternative to the
“commodity lodging” of currently existing brands in the select-service market segment, and the Element brand will
provide modern, upscale hotels for extended stay travel.
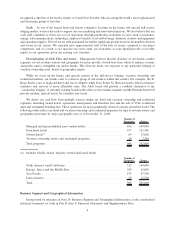
We derive our cash flow from multiple sources within our hotel and vacation ownership and residential
segments, including owned hotels’ operations, management and franchise fees and the sale of VOIs, residential
units and residential branding fees. These operations are in geographically diverse locations around the world. The
following tables reflect our hotel and vacation ownership and residential properties by type of revenue source and
geographical presence by major geographic area as of December 31, 2008:
Number of
Properties Rooms
Managed and unconsolidated joint venture hotels ...................... 436 149,900
Franchised hotels ............................................. 437 111,300
Owned hotels
(a)
............................................... 69 23,600
Vacation ownership resorts and residential properties ................... 26 7,200
Total properties ............................................... 968 292,000
(a) Includes wholly owned, majority owned and leased hotels.
Number of
Properties Rooms
North America (and Caribbean) ................................... 512 169,600
Europe, Africa and the Middle East ................................ 254 62,000
Asia Pacific ................................................. 143 47,700
Latin America................................................ 59 12,700
Total....................................................... 968 292,000
Business Segment and Geographical Information
Incorporated by reference in Note 24. Business Segment and Geographical Information, in the consolidated
financial statements set forth in Part II, Item 8. Financial Statements and Supplementary Data.
4