Starwood 2008 Annual Report Download - page 109
Download and view the complete annual report
Please find page 109 of the 2008 Starwood annual report below. You can navigate through the pages in the report by either clicking on the pages listed below, or by using the keyword search tool below to find specific information within the annual report.-
 1
1 -
2
-
3
-
4
-
5
-
6
-
7
-
8
-
9
-
10
-
11
-
12
-
13
-
14
-
15
-
16
-
17
-
18
-
19
-
20
-
21
-
22
-
23
-
24
-
25
-
26
-
27
-
28
-
29
-
30
-
31
-
32
-
33
-
34
-
35
-
36
-
37
-
38
-
39
-
40
-
41
-
42
-
43
-
44
-
45
-
46
-
47
-
48
-
49
-
50
-
51
-
52
-
53
-
54
-
55
-
56
-
57
-
58
-
59
-
60
-
61
-
62
-
63
-
64
-
65
-
66
-
67
-
68
-
69
-
70
-
71
-
72
-
73
-
74
-
75
-
76
-
77
-
78
-
79
-
80
-
81
-
82
-
83
-
84
-
85
-
86
-
87
-
88
-
89
-
90
-
91
-
92
-
93
-
94
-
95
-
96
-
97
-
98
-
 99
99 -
 100
100 -
 101
101 -
 102
102 -
 103
103 -
 104
104 -
 105
105 -
 106
106 -
 107
107 -
 108
108 -
 109
109 -
 110
110 -
 111
111 -
 112
112 -
 113
113 -
 114
114 -
 115
115 -
 116
116 -
 117
117 -
 118
118 -
 119
119 -
120
-
121
-
122
-
123
-
124
-
125
-
126
-
127
-
128
-
129
-
130
-
131
-
132
-
133
-
134
-
135
-
136
-
137
-
138
-
139
-
140
-
141
-
142
-
143
-
144
-
145
-
146
-
147
-
148
-
149
-
150
-
151
-
152
-
153
-
154
-
155
-
156
-
157
-
158
-
159
-
160
-
161
-
162
-
163
-
164
-
165
-
166
-
167
-
168
-
169
-
170
-
171
-
172
-
173
-
174
-
175
-
176
-
177
-
178
 |
 |

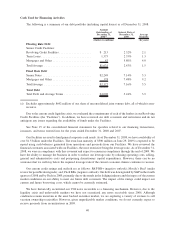
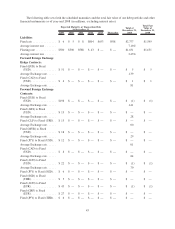
The following table sets forth the scheduled maturities and the total fair value of our debt portfolio and other
financial instruments as of year-end 2008 (in millions, excluding interest rates):
2009 2010 2011 2012 2013 Thereafter
Total at
December 31,
2008
Total Fair
Value at
December 31,
2008
Expected Maturity or Transaction Date
At December 31,
Liabilities
Fixed rate . . . ............ $ 6 $ 5 $ 8 $804 $653 $901 $2,377 $1,599
Average interest rate . ...... 7.16%
Floating rate . ............ $500 $500 $588 $ 43 $ — $ — $1,631 $1,631
Average interest rate . ...... 2.43%
Forward Foreign Exchange
Hedge Contracts:
Fixed (EUR) to Fixed
(USD) ................ $ 51 $ — $ — $ — $ — $ — $ 5 $ 5
Average Exchange rate ...... 1.39
Fixed (CAD) to Fixed
(USD) ................ $ 4 $ — $ — $ — $ — $ — $ 1 $ 1
Average Exchange rate ...... .81
Forward Foreign Exchange
Contracts:
Fixed (EUR) to Fixed
(USD) ................ $198 $ — $ — $ — $ — $ — $ (1) $ (1)
Average Exchange rate ...... 1.41
Fixed (ARS) to Fixed
(USD) ................ $ 15 $ — $ — $ — $ — $ — $ — $ —
Average Exchange rate ...... .28
Fixed (CLP) to Fixed (USD). . $ 15 $ — $ — $ — $ — $ — $ — $ —
Average Exchange rate ...... .00
Fixed (MYR) to Fixed
(USD) ................ $ 18 $ — $ — $ — $ — $ — $ — $ —
Average Exchange rate ...... .29
Fixed (JPY) to Fixed (USD) . . $ 12 $ — $ — $ — $ — $ — $ — $ —
Average Exchange rate ...... .01
Fixed (CAD) to Fixed
(USD) ................ $ 8 $ — $ — $ — $ — $ — $ — $ —
Average Exchange rate ...... .84
Fixed (AUD) to Fixed
(USD) ................ $ 22 $ — $ — $ — $ — $ — $ (1) $ (1)
Average Exchange rate ...... .70
Fixed (JPY) to Fixed (SGD) . . $ 6 $ — $ — $ — $ — $ — $ — $ —
Fixed (SGD) to Fixed
(THB) ................ $ 5 $ — $ — $ — $ — $ — $ — $ —
Fixed (AUD) to Fixed
(EUR) ................ $ 43 $ — $ — $ — $ — $ — $ (1) $ (1)
Fixed (GBP) to Fixed
(EUR) ................ $ 27 $ — $ — $ — $ — $ — $ — $ —
Fixed (JPY) to Fixed (THB) . . $ 6 $ — $ — $ — $ — $ — $ — $ —
43