Shaw 2009 Annual Report Download - page 90
Download and view the complete annual report
Please find page 90 of the 2009 Shaw annual report below. You can navigate through the pages in the report by either clicking on the pages listed below, or by using the keyword search tool below to find specific information within the annual report.-
 1
1 -
2
-
3
-
4
-
5
-
6
-
7
-
8
-
9
-
10
-
11
-
12
-
13
-
14
-
15
-
16
-
17
-
18
-
19
-
20
-
21
-
22
-
23
-
24
-
25
-
26
-
27
-
28
-
29
-
30
-
31
-
32
-
33
-
34
-
35
-
36
-
37
-
38
-
39
-
40
-
41
-
42
-
43
-
44
-
45
-
46
-
47
-
48
-
49
-
50
-
51
-
52
-
53
-
54
-
55
-
56
-
57
-
58
-
59
-
60
-
61
-
62
-
63
-
64
-
65
-
66
-
67
-
68
-
69
-
70
-
71
-
72
-
73
-
74
-
75
-
76
-
77
-
78
-
79
-
 80
80 -
 81
81 -
 82
82 -
 83
83 -
 84
84 -
 85
85 -
 86
86 -
 87
87 -
 88
88 -
 89
89 -
 90
90 -
 91
91 -
 92
92 -
 93
93 -
 94
94 -
 95
95 -
 96
96 -
 97
97 -
 98
98 -
 99
99 -
 100
100 -
101
-
102
-
103
-
104
-
105
-
106
-
107
-
108
-
109
-
110
-
111
-
112
-
113
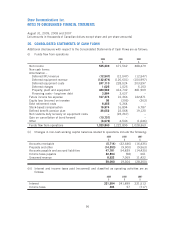
 |
 |

Cable
$
DTH
$
Satellite Services
$
Total
$
Total
$
Satellite
2007
Service revenue – total 2,086,066 611,713 90,117 701,830 2,787,896
Intersegment (3,414) (6,537) (3,500) (10,037) (13,451)
2,082,652 605,176 86,617 691,793 2,774,445
Service operating income before amortization 995,694 196,404 47,527 243,931 1,239,625
Service operating income as % of external
revenue 47.8% 32.5% 54.9% 35.3% 44.7%
Interest
(1)
205,062 n/a n/a 38,563 243,625
Burrard Landing Lot 2 Holdings Partnership 1,418
245,043
Cash taxes
(1)
–– – – –
Segment assets 6,300,834 894,893 529,411 1,424,304 7,725,138
Corporate assets 438,601
Total assets 8,163,739
Capital expenditures and equipment costs (net)
by segment
Capital expenditures 533,485 3,958 5,849 9,807 543,292
Equipment costs (net) 19,546 76,970 – 76,970 96,516
553,031 80,928 5,849 86,777 639,808
Reconciliation to Consolidated Statements of
Cash Flows
Additions to property, plant and equipment 554,565
Additions to equipment costs (net) 96,516
Total of capital expenditures and equipment
costs (net) per Consolidated Statements of
Cash Flows 651,081
Decrease in working capital related to capital
expenditures (7,678)
Less: IRU prepayments
(3)
(7)
Less: Satellite services equipment profit
(4)
(3,588)
Total capital expenditures and equipment
costs (net) reported by segments 639,808
(1) The Company reports interest and cash taxes on a segmented basis for Cable and combined
satellite only. It does not report interest and cash taxes on a segmented basis for DTH and
Satellite Services.
(2) The Company realized gains totaling $13,384 on cancellation of certain of its US dollar
forward purchase contracts in respect of capital expenditures and equipment costs. The gains
were included in other comprehensive income and reclassified to the initial carrying amount
of capital assets or equipment costs when the assets were recognized.
86
Shaw Communications Inc.
NOTES TO CONSOLIDATED FINANCIAL STATEMENTS
August 31, 2009, 2008 and 2007
[all amounts in thousands of Canadian dollars except share and per share amounts]