Shaw 2009 Annual Report Download - page 88
Download and view the complete annual report
Please find page 88 of the 2009 Shaw annual report below. You can navigate through the pages in the report by either clicking on the pages listed below, or by using the keyword search tool below to find specific information within the annual report.-
 1
1 -
2
-
3
-
4
-
5
-
6
-
7
-
8
-
9
-
10
-
11
-
12
-
13
-
14
-
15
-
16
-
17
-
18
-
19
-
20
-
21
-
22
-
23
-
24
-
25
-
26
-
27
-
28
-
29
-
30
-
31
-
32
-
33
-
34
-
35
-
36
-
37
-
38
-
39
-
40
-
41
-
42
-
43
-
44
-
45
-
46
-
47
-
48
-
49
-
50
-
51
-
52
-
53
-
54
-
55
-
56
-
57
-
58
-
59
-
60
-
61
-
62
-
63
-
64
-
65
-
66
-
67
-
68
-
69
-
70
-
71
-
72
-
73
-
74
-
75
-
76
-
77
-
 78
78 -
 79
79 -
 80
80 -
 81
81 -
 82
82 -
 83
83 -
 84
84 -
 85
85 -
 86
86 -
 87
87 -
 88
88 -
 89
89 -
 90
90 -
 91
91 -
 92
92 -
 93
93 -
 94
94 -
 95
95 -
 96
96 -
 97
97 -
 98
98 -
99
-
100
-
101
-
102
-
103
-
104
-
105
-
106
-
107
-
108
-
109
-
110
-
111
-
112
-
113
 |
 |

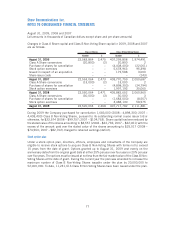
15. BUSINESS SEGMENT INFORMATION
The Company’s operating segments are Cable, DTH and Satellite Services, all of which are
substantially located in Canada.
The accounting policies of the segments are the same as those described in the summary of
significant accounting policies. Management evaluates divisional performance based on service
revenue and service operating income before charges such as amortization.
Cable
$
DTH
$
Satellite Services
$
Total
$
Total
$
Satellite
2009
Service revenue – total 2,635,832 684,831 90,205 775,036 3,410,868
Intersegment (4,850) (11,605) (3,500) (15,105) (19,955)
2,630,982 673,226 86,705 759,931 3,390,913
Service operating income before amortization 1,269,620 223,499 45,831 269,330 1,538,950
Service operating income as % of external
revenue 48.3% 33.2% 52.9% 35.4% 45.4%
Interest
(1)
209,438 n/a n/a 26,251 235,689
Burrard Landing Lot 2 Holdings Partnership 1,358
237,047
Cash taxes
(1)
23,300 – – – 23,300
Segment assets 6,602,503 855,283 498,720 1,354,003 7,956,506
Corporate assets 981,563
Total assets 8,938,069
Capital expenditures and equipment costs (net)
by segment
Capital expenditures 658,862 4,907 192 5,099 663,961
Equipment costs (net) 35,222 76,362 – 76,362 111,584
694,084 81,269 192 81,461 775,545
Reconciliation to Consolidated Statements of
Cash Flows
Additions to property, plant and equipment 677,918
Additions to equipment costs (net) 124,968
Total of capital expenditures and equipment
costs (net) per Consolidated Statements of
Cash Flows 802,886
Increase in working capital related to capital
expenditures 11,559
Less: Proceeds on disposal of property, plant
and equipment (22,081)
Less: Realized gains on cancellation of
US dollar forward purchase contracts
(2)
(13,384)
Less: Satellite services equipment profit
(4)
(3,435)
Total capital expenditures and equipment costs
(net) reported by segments 775,545
See notes following 2007 business segment table.
84
Shaw Communications Inc.
NOTES TO CONSOLIDATED FINANCIAL STATEMENTS
August 31, 2009, 2008 and 2007
[all amounts in thousands of Canadian dollars except share and per share amounts]