Shaw 2009 Annual Report Download - page 51
Download and view the complete annual report
Please find page 51 of the 2009 Shaw annual report below. You can navigate through the pages in the report by either clicking on the pages listed below, or by using the keyword search tool below to find specific information within the annual report.-
 1
1 -
2
-
3
-
4
-
5
-
6
-
7
-
8
-
9
-
10
-
11
-
12
-
13
-
14
-
15
-
16
-
17
-
18
-
19
-
20
-
21
-
22
-
23
-
24
-
25
-
26
-
27
-
28
-
29
-
30
-
31
-
32
-
33
-
34
-
35
-
36
-
37
-
38
-
39
-
40
-
 41
41 -
 42
42 -
 43
43 -
 44
44 -
 45
45 -
 46
46 -
 47
47 -
 48
48 -
 49
49 -
 50
50 -
 51
51 -
 52
52 -
 53
53 -
 54
54 -
 55
55 -
 56
56 -
 57
57 -
 58
58 -
 59
59 -
 60
60 -
 61
61 -
62
-
63
-
64
-
65
-
66
-
67
-
68
-
69
-
70
-
71
-
72
-
73
-
74
-
75
-
76
-
77
-
78
-
79
-
80
-
81
-
82
-
83
-
84
-
85
-
86
-
87
-
88
-
89
-
90
-
91
-
92
-
93
-
94
-
95
-
96
-
97
-
98
-
99
-
100
-
101
-
102
-
103
-
104
-
105
-
106
-
107
-
108
-
109
-
110
-
111
-
112
-
113
 |
 |
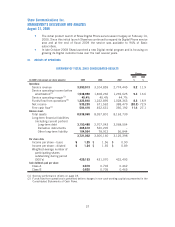
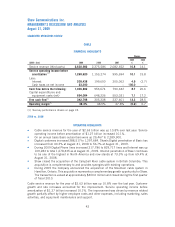
SATELLITE (DTH and Satellite Services)
2009 vs. 2008
OPERATING HIGHLIGHTS
kFree cash flow of $161.6 million for the year compares to $147.3 million last year.
kDuring the year Shaw Direct added 8,413 customers and as at August 31, 2009 customers
now total 900,941.
Service revenue of $759.9 million for the current year was up 4.2% over last year. The improvement
was primarily due to rate increases and customer growth. Service operating income before
amortization for the DTH segment was up 8.2% to $223.5 million. The increase was mainly
due to the revenue related improvement partially offset by costs to support customer service and
other costs related to growth. In the Satellite services segment service operating income before
amortization was down 5.3% due to lower contribution resulting from the economic impact on Shaw
Tracking. On an annual basis total Satellite service operating income before amortization was up
5.6% to $269.3 million.
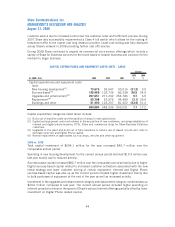
Total capital investment of $81.5 million for the year was comparable to the prior year spend of
$78.1 million, respectively. The increase in Transponder and other in 2009 was mainly due to the
relocation and expansion of the Montreal call centre.
During the year Shaw Direct added 12 HD channels and since August 31, 2009 added an additional
3 to now carry a total of 57 HD channels. During 2009 Shaw Directs’ HD customer base increased
to almost 325,000.
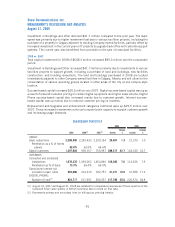
2008 vs. 2007
OPERATING HIGHLIGHTS
kFree cash flow of $147.3 million for 2008 compares to $118.6 million in 2007.
kDuring 2008 Shaw Direct added 12,943 customers and as at August 31, 2008 customers
totaled 892,528.
Service revenue was up 5.4% over 2007 to $729.3 million. The improvement was primarily due to
rate increases and customer growth. Service operating income before amortization of
$255.0 million improved 4.5% over the comparable period. The increase was mainly due to
the revenue related growth partially offset by higher employee related and other costs to support
growth. The comparative period also benefitted from the recovery of provisions related to certain
contractual matters.
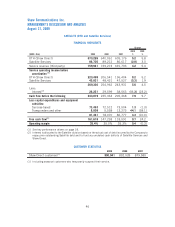
Total capital investment of $78.1 million in 2008 compared to $86.8 million in the prior year.
Success-based capital declined primarily due to HD expansion projects undertaken in the latter part
of 2007 and a duty recovery in 2008. These favorable variances were partially offset by increased
activations.
The decline in Transponders and other was due to investments made in 2007 to upgrade certain
Satellite Service technology and office equipment to support call centre expansions as well as
spending related to HD expansion projects.
During 2008 Shaw Direct added 17 HD channels and increased its HD customer base by
approximately 100,000.
47
Shaw Communications Inc.
MANAGEMENT’S DISCUSSION AND ANALYSIS
August 31, 2009