Shaw 2009 Annual Report Download - page 40
Download and view the complete annual report
Please find page 40 of the 2009 Shaw annual report below. You can navigate through the pages in the report by either clicking on the pages listed below, or by using the keyword search tool below to find specific information within the annual report.-
 1
1 -
2
-
3
-
4
-
5
-
6
-
7
-
8
-
9
-
10
-
11
-
12
-
13
-
14
-
15
-
16
-
17
-
18
-
19
-
20
-
21
-
22
-
23
-
24
-
25
-
26
-
27
-
28
-
29
-
 30
30 -
 31
31 -
 32
32 -
 33
33 -
 34
34 -
 35
35 -
 36
36 -
 37
37 -
 38
38 -
 39
39 -
 40
40 -
 41
41 -
 42
42 -
 43
43 -
 44
44 -
 45
45 -
 46
46 -
 47
47 -
 48
48 -
 49
49 -
 50
50 -
51
-
52
-
53
-
54
-
55
-
56
-
57
-
58
-
59
-
60
-
61
-
62
-
63
-
64
-
65
-
66
-
67
-
68
-
69
-
70
-
71
-
72
-
73
-
74
-
75
-
76
-
77
-
78
-
79
-
80
-
81
-
82
-
83
-
84
-
85
-
86
-
87
-
88
-
89
-
90
-
91
-
92
-
93
-
94
-
95
-
96
-
97
-
98
-
99
-
100
-
101
-
102
-
103
-
104
-
105
-
106
-
107
-
108
-
109
-
110
-
111
-
112
-
113
 |
 |

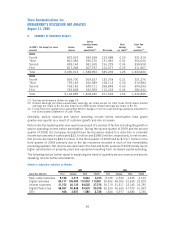
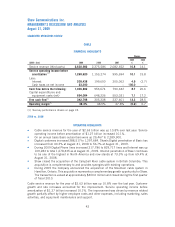
II. SUMMARY OF QUARTERLY RESULTS
(In $000’s Cdn except per share
amounts)
Service
revenue
Service
operating income
before
amortization
(1)
Net income
Basic
earnings
per share
(2)
Funds flow
from
operations
(3)
2009
Fourth 872,919 394,528 123,988 0.29 321,319
Third 861,382 395,270 131,945 0.31 356,046
Second 839,144 381,355 156,229 0.36 334,508
First 817,468 367,797 123,077 0.29 311,967
Total 3,390,913 1,538,950 535,239 1.25 1,323,840
2008
Fourth 805,700 369,527 132,378 0.31 321,276
Third 792,149 356,089 128,113 0.30 310,984
Second 763,182 349,711 298,848 0.69 304,293
First 743,828 332,909 112,223 0.26 286,342
Total 3,104,859 1,408,236 671,562 1.56 1,222,895
(1) See key performance drivers on page 18.
(2) Diluted earnings per share equals basic earnings per share except for total fiscal 2009 where diluted
earnings per share is $1.24 and total fiscal 2008 where diluted earnings per share is $1.55.
(3) Funds flow from operations is presented before changes in net non-cash working capital as presented in
the Consolidated Statement of Cash Flows.
Generally, service revenue and service operating income before amortization have grown
quarter-over-quarter as a result of customer growth and rate increases.
Net income fluctuated quarter-over-quarter as a result of a number of factors including the growth in
service operating income before amortization. During the second quarter of 2009 and the second
quarter of 2008, the Company recorded future tax recoveries related to a reduction in corporate
income tax rates which contributed $22.6 million and $188.0 million, respectively, to net income.
Net income declined by $24.3 million in the third quarter of 2009 and by $170.7 million in the
third quarter of 2008 primarily due to the tax recoveries recorded in each of the immediately
preceding quarters. Net income also declined in the first and fourth quarters of 2009 mainly due to
higher amortization of property, plant and equipment resulting from increased capital spending.
The following factors further assist in explaining the trend of quarterly service revenue and service
operating income before amortization:
Growth in subscriber statistics as follows:
Subscriber Statistics First Second Third Fourth First Second Third Fourth
2009 2008
Basic cable customers 9,198 4,273 9,622 6,374 8,138 6,524 2,495 4,122
Digital customers 60,717 106,489 110,810 110,501 39,496 48,006 32,658 23,020
Internet customers 31,152 26,130 24,625 27,376 34,719 31,517 23,185 24,785
Digital Phone lines 56,597 50,848 54,633 55,708 50,339 56,536 57,700 61,999
DTH 448 3,657 1,580 2,728 1,544 4,977 4,686 1,736
36
Shaw Communications Inc.
MANAGEMENT’S DISCUSSION AND ANALYSIS
August 31, 2009