Shaw 2009 Annual Report Download - page 103
Download and view the complete annual report
Please find page 103 of the 2009 Shaw annual report below. You can navigate through the pages in the report by either clicking on the pages listed below, or by using the keyword search tool below to find specific information within the annual report.-
 1
1 -
2
-
3
-
4
-
5
-
6
-
7
-
8
-
9
-
10
-
11
-
12
-
13
-
14
-
15
-
16
-
17
-
18
-
19
-
20
-
21
-
22
-
23
-
24
-
25
-
26
-
27
-
28
-
29
-
30
-
31
-
32
-
33
-
34
-
35
-
36
-
37
-
38
-
39
-
40
-
41
-
42
-
43
-
44
-
45
-
46
-
47
-
48
-
49
-
50
-
51
-
52
-
53
-
54
-
55
-
56
-
57
-
58
-
59
-
60
-
61
-
62
-
63
-
64
-
65
-
66
-
67
-
68
-
69
-
70
-
71
-
72
-
73
-
74
-
75
-
76
-
77
-
78
-
79
-
80
-
81
-
82
-
83
-
84
-
85
-
86
-
87
-
88
-
89
-
90
-
91
-
92
-
 93
93 -
 94
94 -
 95
95 -
 96
96 -
 97
97 -
 98
98 -
 99
99 -
 100
100 -
 101
101 -
 102
102 -
 103
103 -
 104
104 -
 105
105 -
 106
106 -
 107
107 -
 108
108 -
 109
109 -
 110
110 -
 111
111 -
 112
112 -
 113
113
 |
 |

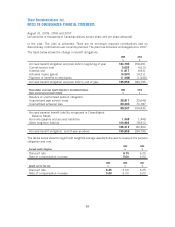
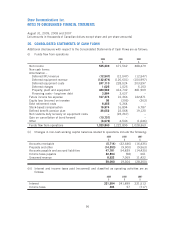
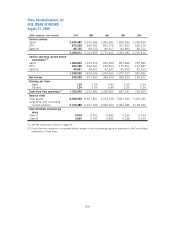
Consolidated Balance Sheet items using US GAAP
Canadian
GAAP
$
US
GAAP
$
Canadian
GAAP
$
US
GAAP
$
2009 2008
Property, plant and equipment
(10)
2,821,544 2,829,257 2,616,500 2,622,877
Deferred charges
(2)(8)
259,738 170,260 274,666 175,818
Broadcast rights
(1)(5)(6)
4,816,153 4,790,919 4,776,078 4,750,844
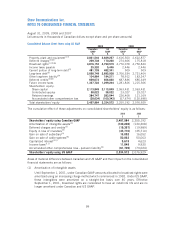
Income taxes payable 25,320 5,446 2,446 2,446
Current portion of long-term debt
(2)
481,739 482,341 509 509
Long-term debt
(2)
2,668,749 2,695,908 2,706,534 2,731,404
Other long-term liability
(9)
104,964 194,211 78,912 183,347
Deferred credits
(2)(8)
659,073 656,830 687,836 685,349
Future income taxes 1,337,722 1,299,244 1,281,826 1,215,566
Shareholders’ equity:
Share capital 2,113,849 2,113,849 2,063,431 2,063,431
Contributed surplus 38,022 38,022 23,027 23,027
Retained earnings 384,747 283,044 226,408 121,169
Accumulated other comprehensive loss (38,634) (100,343) (57,674) (130,698)
Total shareholders’ equity 2,497,984 2,334,572 2,255,192 2,076,929
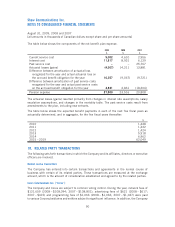
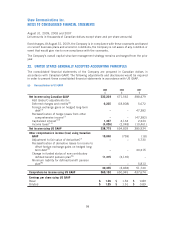
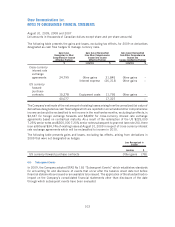
The cumulative effect of these adjustments on consolidated shareholders’ equity is as follows:
2009
$
2008
$
Shareholders’ equity using Canadian GAAP 2,497,984 2,255,192
Amortization of intangible assets
(1)
(130,208) (130,208)
Deferred charges and credits
(2)
(19,367) (19,989)
Equity in loss of investees
(4)
(35,710) (35,710)
Gain on sale of subsidiary
(5)
16,052 16,052
Gain on sale of cable systems
(6)
50,063 50,063
Capitalized interest
(10)
5,619 4,623
Income taxes
(11)
11,848 9,930
Accumulated other comprehensive loss – pension liability
(9)
(61,709) (73,024)
Shareholders’ equity using US GAAP 2,334,572 2,076,929
Areas of material difference between Canadian and US GAAP and their impact on the consolidated
financial statements are as follows:
(1) Amortization of intangible assets
Until September 1, 2001, under Canadian GAAP amounts allocated to broadcast rights were
amortized using an increasing charge method which commenced in 1992. Under US GAAP,
these intangibles were amortized on a straight-line basis over 40 years. Effective
September 1, 2001, broadcast rights are considered to have an indefinite life and are no
longer amortized under Canadian and US GAAP.
99
Shaw Communications Inc.
NOTES TO CONSOLIDATED FINANCIAL STATEMENTS
August 31, 2009, 2008 and 2007
[all amounts in thousands of Canadian dollars except share and per share amounts]