Shaw 2009 Annual Report Download - page 75
Download and view the complete annual report
Please find page 75 of the 2009 Shaw annual report below. You can navigate through the pages in the report by either clicking on the pages listed below, or by using the keyword search tool below to find specific information within the annual report.-
 1
1 -
2
-
3
-
4
-
5
-
6
-
7
-
8
-
9
-
10
-
11
-
12
-
13
-
14
-
15
-
16
-
17
-
18
-
19
-
20
-
21
-
22
-
23
-
24
-
25
-
26
-
27
-
28
-
29
-
30
-
31
-
32
-
33
-
34
-
35
-
36
-
37
-
38
-
39
-
40
-
41
-
42
-
43
-
44
-
45
-
46
-
47
-
48
-
49
-
50
-
51
-
52
-
53
-
54
-
55
-
56
-
57
-
58
-
59
-
60
-
61
-
62
-
63
-
64
-
 65
65 -
 66
66 -
 67
67 -
 68
68 -
 69
69 -
 70
70 -
 71
71 -
 72
72 -
 73
73 -
 74
74 -
 75
75 -
 76
76 -
 77
77 -
 78
78 -
 79
79 -
 80
80 -
 81
81 -
 82
82 -
 83
83 -
 84
84 -
 85
85 -
86
-
87
-
88
-
89
-
90
-
91
-
92
-
93
-
94
-
95
-
96
-
97
-
98
-
99
-
100
-
101
-
102
-
103
-
104
-
105
-
106
-
107
-
108
-
109
-
110
-
111
-
112
-
113
 |
 |

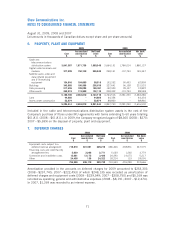
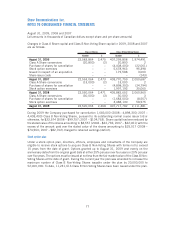
6. PROPERTY, PLANT AND EQUIPMENT
Cost
$
Accumulated
amortization
$
Net book
value
$
Cost
$
Accumulated
amortization
$
Net book
value
$
2009 2008
Cable and
telecommunications
distribution system 3,841,087 1,871,738 1,969,349 3,664,151 1,784,014 1,880,137
Digital cable terminals and
modems 377,698 150,749 226,949 258,141 112,794 145,347
Satellite audio, video and
data network equipment
and DTH receiving
equipment 154,916 104,600 50,316 153,352 90,453 62,899
Buildings 343,605 106,986 236,619 327,641 96,108 231,533
Data processing 217,455 109,088 108,367 152,929 78,107 74,822
Other assets 252,019 119,909 132,110 208,302 119,754 88,548
5,186,780 2,463,070 2,723,710 4,764,516 2,281,230 2,483,286
Land 44,860 – 44,860 44,354 – 44,354
Assets under construction 52,974 – 52,974 88,860 – 88,860
5,284,614 2,463,070 2,821,544 4,897,730 2,281,230 2,616,500
Included in the cable and telecommunications distribution system assets is the cost of the
Company’s purchase of fibres under IRU agreements with terms extending to 60 years totalling
$61,811 (2008 – $61,811). In 2009, the Company recognized a gain of $8,360 (2008 – $270;
2007 – $5,699) on the disposal of property, plant and equipment.
7. DEFERRED CHARGES
Cost
$
Accumulated
amortization
$
Net book
value
$
Cost
$
Accumulated
amortization
$
Net book
value
$
2009 2008
Equipment costs subject to a
deferred revenue arrangement 710,810 481,591 229,219 686,406 438,831 247,575
Financing costs and credit facility
arrangement fees 5,039 2,268 2,771 5,039 1,260 3,779
Connection and installation costs 15,601 12,175 3,426 24,290 19,073 5,217
Other 24,458 136 24,322 18,214 119 18,095
755,908 496,170 259,738 733,949 459,283 274,666
Amortization provided in the accounts on deferred charges for 2009 amounted to $253,303
(2008 – $237,740; 2007 – $222,493) of which $248,135 was recorded as amortization of
deferred charges and equipment costs (2008 – $229,549; 2007 – $208,750) and $5,168 was
recorded as operating, general and administrative expenses (2008 – $8,191; 2007 – $12,474).
In 2007, $1,269 was recorded to as interest expense.
71
Shaw Communications Inc.
NOTES TO CONSOLIDATED FINANCIAL STATEMENTS
August 31, 2009, 2008 and 2007
[all amounts in thousands of Canadian dollars except share and per share amounts]