Shaw 2009 Annual Report Download - page 45
Download and view the complete annual report
Please find page 45 of the 2009 Shaw annual report below. You can navigate through the pages in the report by either clicking on the pages listed below, or by using the keyword search tool below to find specific information within the annual report.-
 1
1 -
2
-
3
-
4
-
5
-
6
-
7
-
8
-
9
-
10
-
11
-
12
-
13
-
14
-
15
-
16
-
17
-
18
-
19
-
20
-
21
-
22
-
23
-
24
-
25
-
26
-
27
-
28
-
29
-
30
-
31
-
32
-
33
-
34
-
 35
35 -
 36
36 -
 37
37 -
 38
38 -
 39
39 -
 40
40 -
 41
41 -
 42
42 -
 43
43 -
 44
44 -
 45
45 -
 46
46 -
 47
47 -
 48
48 -
 49
49 -
 50
50 -
 51
51 -
 52
52 -
 53
53 -
 54
54 -
 55
55 -
56
-
57
-
58
-
59
-
60
-
61
-
62
-
63
-
64
-
65
-
66
-
67
-
68
-
69
-
70
-
71
-
72
-
73
-
74
-
75
-
76
-
77
-
78
-
79
-
80
-
81
-
82
-
83
-
84
-
85
-
86
-
87
-
88
-
89
-
90
-
91
-
92
-
93
-
94
-
95
-
96
-
97
-
98
-
99
-
100
-
101
-
102
-
103
-
104
-
105
-
106
-
107
-
108
-
109
-
110
-
111
-
112
-
113
 |
 |

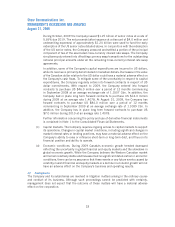
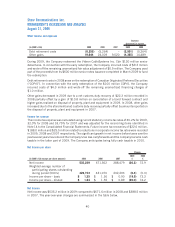
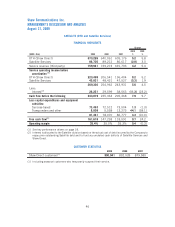
In 2009, net income decreased $136.3 million compared to the prior year. The lower net income
was mainly due to decreased taxes in the prior year of $174.4 million that included a
$188.0 million future tax recovery compared to a current year recovery of $22.6 million. The
recoveries were related to reductions in corporate income tax rates. The current year benefitted from
higher service operating income before amortization of $130.7 million partially offset by increased
amortization of $78.4 million.
In 2008, net income increased $283.1 million over the prior year. The improvement was mainly
due to higher service operating income before amortization of $168.6 million, and reduced interest
expense of $14.5 million, partially offset by increased amortization of $35.7 million. The 2008
and 2007 years included future tax recoveries related to reductions in enacted income tax rates of
$188.0 million and $25.5 million, respectively. The benefit of the higher tax recovery in 2008 was
partially offset by increased taxes related to higher service operating income before amortization.
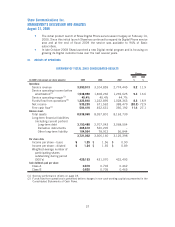
(In $millions Cdn) 2009 2008
Increased service operating income before amortization 130.7 168.6
Increased amortization of deferred net equipment costs and revenue and
IRU revenue (12.2) (3.3)
Increased amortization of deferred charges, financing costs and property,
plant and equipment (66.2) (32.4)
Decreased (increased) interest expense (6.5) 14.5
Change in other net costs and revenue
1
(7.7) 9.2
Decreased (increased) income taxes (174.4) 126.5
(136.3) 283.1
(1) Other net costs and revenue include debt retirement costs, equity income (loss) on investee and other
gains as detailed in the Consolidated Statements of Income and Retained Earnings (Deficit).
41
Shaw Communications Inc.
MANAGEMENT’S DISCUSSION AND ANALYSIS
August 31, 2009