Shaw 2009 Annual Report Download - page 48
Download and view the complete annual report
Please find page 48 of the 2009 Shaw annual report below. You can navigate through the pages in the report by either clicking on the pages listed below, or by using the keyword search tool below to find specific information within the annual report.-
 1
1 -
2
-
3
-
4
-
5
-
6
-
7
-
8
-
9
-
10
-
11
-
12
-
13
-
14
-
15
-
16
-
17
-
18
-
19
-
20
-
21
-
22
-
23
-
24
-
25
-
26
-
27
-
28
-
29
-
30
-
31
-
32
-
33
-
34
-
35
-
36
-
37
-
 38
38 -
 39
39 -
 40
40 -
 41
41 -
 42
42 -
 43
43 -
 44
44 -
 45
45 -
 46
46 -
 47
47 -
 48
48 -
 49
49 -
 50
50 -
 51
51 -
 52
52 -
 53
53 -
 54
54 -
 55
55 -
 56
56 -
 57
57 -
 58
58 -
59
-
60
-
61
-
62
-
63
-
64
-
65
-
66
-
67
-
68
-
69
-
70
-
71
-
72
-
73
-
74
-
75
-
76
-
77
-
78
-
79
-
80
-
81
-
82
-
83
-
84
-
85
-
86
-
87
-
88
-
89
-
90
-
91
-
92
-
93
-
94
-
95
-
96
-
97
-
98
-
99
-
100
-
101
-
102
-
103
-
104
-
105
-
106
-
107
-
108
-
109
-
110
-
111
-
112
-
113
 |
 |

customer service due to increased control over the customer order and fulfillment process. During
2007 Shaw also successfully implemented a Class 4 toll switch which allows for the routing of
telephone traffic to the lowest cost long distance provider. Least cost routing was fully deployed
across Shaw’s network in 2008 providing further cost efficiencies.
During 2008 Shaw continued to expand its commercial voice service offerings which include a
variety of Shaw for Business services for the home based or smaller business and a service for the
medium to larger business.
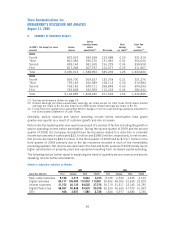
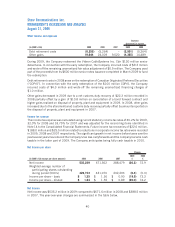
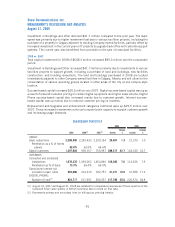
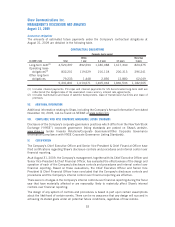
CAPITAL EXPENDITURES AND EQUIPMENT COSTS (NET) – CABLE
(In $000’s Cdn) 2009 2008 2007
2009
%
2008
%
Change
Capital expenditures and equipment costs
(net):
New housing development
(1)
73,676 93,547 90,016 (21.2) 3.9
Success-based
(2)
185,469 102,735 82,238 80.5 24.9
Upgrades and enhancement
(3)
297,651 271,242 254,786 9.7 6.5
Replacement
(4)
55,798 57,575 44,489 (3.1) 29.4
Buildings and other 81,490 123,237 81,502 (33.9) 51.2
694,084 648,336 553,031 7.1 17.2
Capital expenditure categories listed above include:
(1) Build out of mainline cable and the addition of drops in new subdivisions.
(2) Capital and equipment costs (net) related to the acquisition of new customers, including installation of
internet and digital phone modems, DCTs, filters and commercial drops for Shaw Business Solutions
customers.
(3) Upgrades to the plant and build out of fibre backbone to reduce use of leased circuits and costs to
decrease node size and Digital Phone capital.
(4) Normal replacement of aged assets such as drops, vehicles and other equipment.
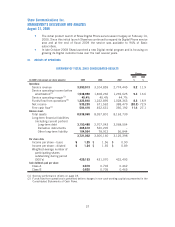
2009 vs. 2008
Total capital investment of $694.1 million for the year increased $45.7 million over the
comparable annual period.
Spending in new housing development for the current annual period declined $19.9 million over
last year mainly due to reduced activity.
Success-based capital increased $82.7 million over the comparable period primarily due to higher
Digital success-based capital related to increased customer activations associated with the new
rental strategy and lower customer pricing of certain equipment. Internet and Digital Phone
success-based capital was also up as the current period included higher investment mainly due
to bulk purchases of equipment at the end of the year as well as increased activity.
Investment in the upgrades and enhancement category and replacement category combined was up
$24.6 million compared to last year. The current annual period included higher spending on
Internet projects to enhance the speed of Shaw’s various Internet offerings partially offset by lower
investment on Digital Phone related capital.
44
Shaw Communications Inc.
MANAGEMENT’S DISCUSSION AND ANALYSIS
August 31, 2009