Shaw 2009 Annual Report Download - page 82
Download and view the complete annual report
Please find page 82 of the 2009 Shaw annual report below. You can navigate through the pages in the report by either clicking on the pages listed below, or by using the keyword search tool below to find specific information within the annual report.-
 1
1 -
2
-
3
-
4
-
5
-
6
-
7
-
8
-
9
-
10
-
11
-
12
-
13
-
14
-
15
-
16
-
17
-
18
-
19
-
20
-
21
-
22
-
23
-
24
-
25
-
26
-
27
-
28
-
29
-
30
-
31
-
32
-
33
-
34
-
35
-
36
-
37
-
38
-
39
-
40
-
41
-
42
-
43
-
44
-
45
-
46
-
47
-
48
-
49
-
50
-
51
-
52
-
53
-
54
-
55
-
56
-
57
-
58
-
59
-
60
-
61
-
62
-
63
-
64
-
65
-
66
-
67
-
68
-
69
-
70
-
71
-
 72
72 -
 73
73 -
 74
74 -
 75
75 -
 76
76 -
 77
77 -
 78
78 -
 79
79 -
 80
80 -
 81
81 -
 82
82 -
 83
83 -
 84
84 -
 85
85 -
 86
86 -
 87
87 -
 88
88 -
 89
89 -
 90
90 -
 91
91 -
 92
92 -
93
-
94
-
95
-
96
-
97
-
98
-
99
-
100
-
101
-
102
-
103
-
104
-
105
-
106
-
107
-
108
-
109
-
110
-
111
-
112
-
113
 |
 |

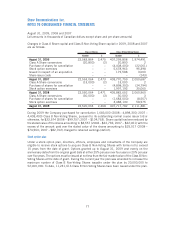
The changes in options in 2009, 2008 and 2007 are as follows:
Number
Weighted
average
exercise
price
$ Number
Weighted
average
exercise
price
$ Number
Weighted
average
exercise
price
$
2009 2008 2007
Outstanding, beginning of year 23,963,771 19.77 17,574,801 17.08 19,117,602 16.30
Granted 4,373,000 19.62 10,486,500 23.73 6,693,500 19.03
Forfeited (1,133,974) 20.67 (2,133,939) 20.04 (2,594,140) 17.56
Exercised (3,488,130) 16.34 (1,963,591) 16.48 (5,642,161) 16.28
Outstanding, end of year 23,714,667 20.21 23,963,771 19.77 17,574,801 17.08
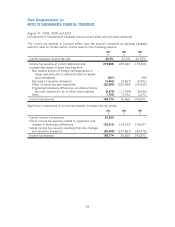
The following table summarizes information about the options outstanding at August 31, 2009:
Range of prices
Number
outstanding at
August 31,
2009
Weighted
average
remaining
contractual life
Weighted
average
exercise
price
Number
exercisable at
August 31,
2009
Weighted
average
remaining
contractual life
Weighted
average
exercise
price
Options outstanding Options exercisable
$8.69 20,000 4.14 $ 8.69 20,000 4.14 $ 8.69
$14.85 – $22.27 15,509,667 6.57 $17.98 7,710,671 4.33 $16.86
$22.28 – $26.20 8,185,000 8.01 $24.45 2,202,375 7.99 $24.30
The aggregate intrinsic value of exerciseable in-the-money options at August 31, 2009 is $16,539.
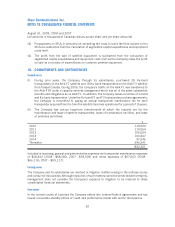
The weighted average estimated fair value at the date of the grant for common share options granted
for the year ended August 31, 2009 was $3.02 (2008 – $5.01; 2007 – $3.73) per option. The fair
value of each option granted was estimated on the date of the grant using the Black-Scholes Option
Pricing Model with the following weighted-average assumptions:
2009 2008 2007
Dividend yield 4.28% 2.92% 2.79%
Risk-free interest rate 1.94% 4.21% 4.12%
Expected life of options 5 years 5 years 4 years
Expected volatility factor of the future expected market price
of Class B Non-Voting Shares 26.5% 24.5% 26.0%
Other stock options
In conjunction with the acquisition of Satellite Services, holders of Satellite Services options
elected to receive 0.9 of one of the Company’s Class B Non-Voting Shares in lieu of one Satellite
Services share which would have been received upon the exercise of a Satellite Services option
under the Satellite Services option plan.
During 2008, the remaining 37,336 Satellite Services options were exercised (2007 – 40,336) for
$145 (2007 – $367).
78
Shaw Communications Inc.
NOTES TO CONSOLIDATED FINANCIAL STATEMENTS
August 31, 2009, 2008 and 2007
[all amounts in thousands of Canadian dollars except share and per share amounts]