Shaw 2009 Annual Report Download - page 64
Download and view the complete annual report
Please find page 64 of the 2009 Shaw annual report below. You can navigate through the pages in the report by either clicking on the pages listed below, or by using the keyword search tool below to find specific information within the annual report.
Shaw Communications Inc.
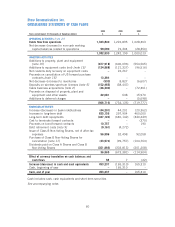
CONSOLIDATED STATEMENTS OF CASH FLOWS
Years ended August 31 [thousands of Canadian dollars]
2009
$
2008
$
2007
$
OPERATING ACTIVITIES [note 20]
Funds flow from operations 1,323,840 1,222,895 1,028,363
Net decrease (increase) in non-cash working
capital balances related to operations 59,090 19,304 (28,350)
1,382,930 1,242,199 1,000,013
INVESTING ACTIVITIES
Additions to property, plant and equipment
[note 15] (677,918) (606,093) (554,565)
Additions to equipment costs (net) [note 15] (124,968) (121,327) (96,516)
Net customs duty recovery on equipment costs –22,267 –
Proceeds on cancellation of US forward purchase
contracts [note 15] 13,384 ––
Net decrease (increase) to inventories (530) 8,827 (6,607)
Deposits on wireless spectrum licenses [note 5] (152,465) (38,447) –
Cable business acquisitions [note 2] (46,300) – (72,361)
Proceeds on disposal of property, plant and
equipment and other assets 22,081 638 15,970
Additions to deferred charges –– (5,698)
(966,716) (734,135) (719,777)
FINANCING ACTIVITIES
Increase (decrease) in bank indebtedness (44,201) 44,201 (20,362)
Increase in long-term debt 835,155 297,904 460,000
Long-term debt repayments (427,124) (640,142) (340,449)
Cost to terminate forward contracts –– (370)
Proceeds on bond forward contracts 10,757 – 190
Debt retirement costs [note 9] (9,161) (4,272) –
Issue of Class B Non-Voting Shares, net of after-tax
expenses 56,996 32,498 92,058
Purchase of Class B Non-Voting Shares for
cancellation [note 11] (33,574) (99,757) (104,763)
Dividends paid on Class A Shares and Class B
Non-Voting Shares (351,883) (303,813) (201,208)
36,965 (673,381) (114,904)
Effect of currency translation on cash balances and
cash flows 58 7 (22)
Increase (decrease) in cash and cash equivalents 453,237 (165,310) 165,310
Cash, beginning of year –165,310 –
Cash, end of year 453,237 – 165,310
Cash includes cash, cash equivalents and short-term securities
See accompanying notes
60


